Immigrants from Bolivia vs Immigrants from South Central Asia 4th Grade
COMPARE
Immigrants from Bolivia
Immigrants from South Central Asia
4th Grade
4th Grade Comparison
Immigrants from Bolivia
Immigrants from South Central Asia
96.9%
4TH GRADE
0.1/ 100
METRIC RATING
278th/ 347
METRIC RANK
97.6%
4TH GRADE
76.2/ 100
METRIC RATING
152nd/ 347
METRIC RANK
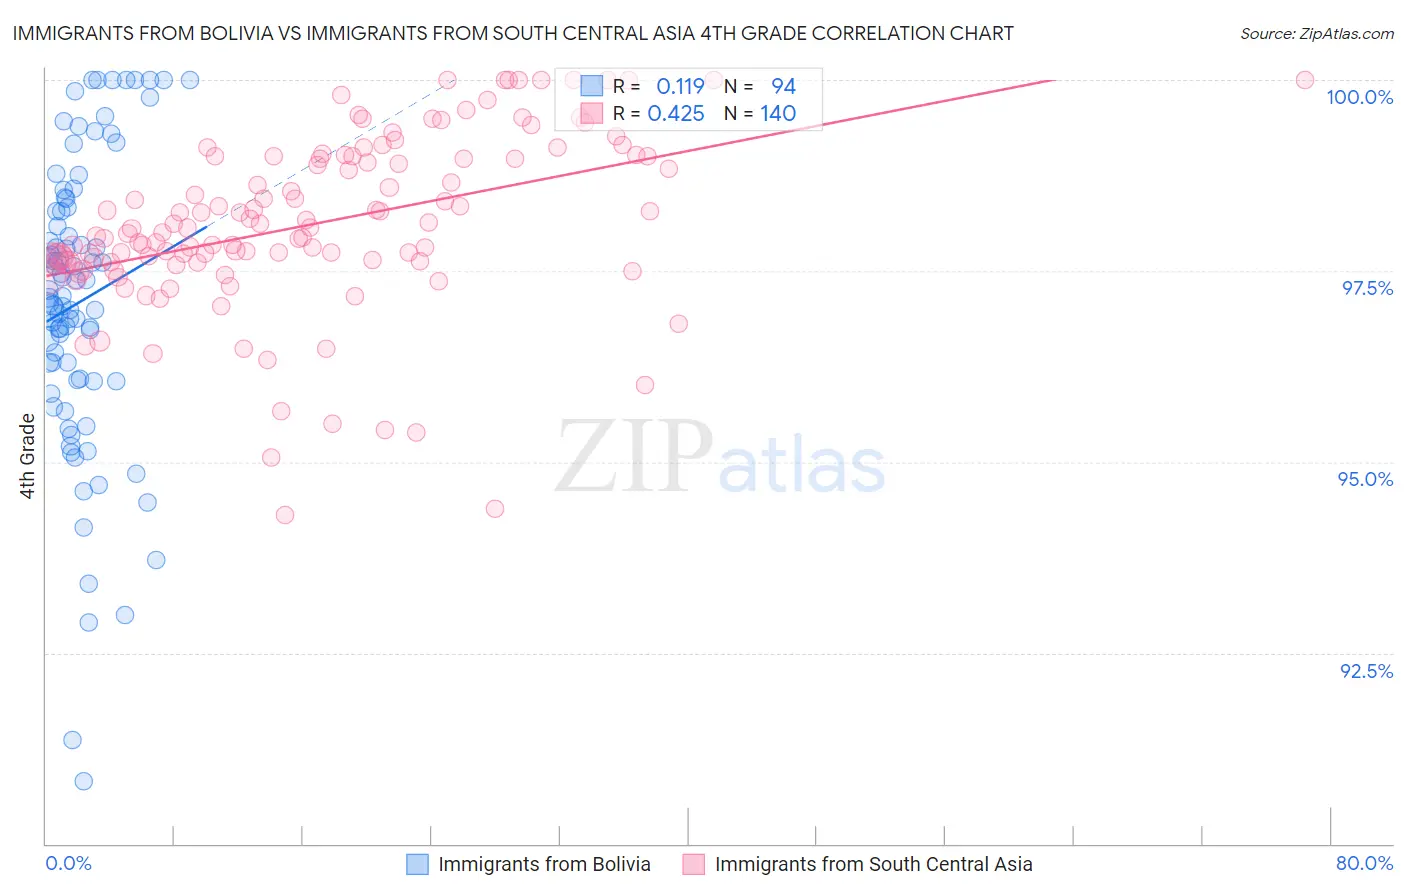
Immigrants from Bolivia vs Immigrants from South Central Asia 4th Grade Correlation Chart
The statistical analysis conducted on geographies consisting of 158,719,812 people shows a poor positive correlation between the proportion of Immigrants from Bolivia and percentage of population with at least 4th grade education in the United States with a correlation coefficient (R) of 0.119 and weighted average of 96.9%. Similarly, the statistical analysis conducted on geographies consisting of 473,113,181 people shows a moderate positive correlation between the proportion of Immigrants from South Central Asia and percentage of population with at least 4th grade education in the United States with a correlation coefficient (R) of 0.425 and weighted average of 97.6%, a difference of 0.77%.
4th Grade Correlation Summary
| Measurement | Immigrants from Bolivia | Immigrants from South Central Asia |
| Minimum | 90.8% | 94.3% |
| Maximum | 100.0% | 100.0% |
| Range | 9.2% | 5.7% |
| Mean | 97.1% | 98.1% |
| Median | 97.2% | 98.1% |
| Interquartile 25% (IQ1) | 96.1% | 97.6% |
| Interquartile 75% (IQ3) | 98.3% | 99.0% |
| Interquartile Range (IQR) | 2.3% | 1.4% |
| Standard Deviation (Sample) | 1.9% | 1.1% |
| Standard Deviation (Population) | 1.9% | 1.1% |
Similar Demographics by 4th Grade
Demographics Similar to Immigrants from Bolivia by 4th Grade
In terms of 4th grade, the demographic groups most similar to Immigrants from Bolivia are Immigrants from Western Africa (96.9%, a difference of 0.0%), Immigrants from Ghana (96.9%, a difference of 0.010%), Yaqui (96.9%, a difference of 0.010%), Afghan (96.9%, a difference of 0.010%), and Trinidadian and Tobagonian (96.9%, a difference of 0.020%).
| Demographics | Rating | Rank | 4th Grade |
| Immigrants | Peru | 0.1 /100 | #271 | Tragic 96.9% |
| Fijians | 0.1 /100 | #272 | Tragic 96.9% |
| Immigrants | Cameroon | 0.1 /100 | #273 | Tragic 96.9% |
| Trinidadians and Tobagonians | 0.1 /100 | #274 | Tragic 96.9% |
| Immigrants | Ghana | 0.1 /100 | #275 | Tragic 96.9% |
| Yaqui | 0.1 /100 | #276 | Tragic 96.9% |
| Immigrants | Western Africa | 0.1 /100 | #277 | Tragic 96.9% |
| Immigrants | Bolivia | 0.1 /100 | #278 | Tragic 96.9% |
| Afghans | 0.1 /100 | #279 | Tragic 96.9% |
| Barbadians | 0.1 /100 | #280 | Tragic 96.9% |
| Immigrants | Hong Kong | 0.1 /100 | #281 | Tragic 96.9% |
| Immigrants | Trinidad and Tobago | 0.1 /100 | #282 | Tragic 96.8% |
| Immigrants | Philippines | 0.1 /100 | #283 | Tragic 96.8% |
| Immigrants | St. Vincent and the Grenadines | 0.1 /100 | #284 | Tragic 96.8% |
| Immigrants | Barbados | 0.0 /100 | #285 | Tragic 96.8% |
Demographics Similar to Immigrants from South Central Asia by 4th Grade
In terms of 4th grade, the demographic groups most similar to Immigrants from South Central Asia are Soviet Union (97.6%, a difference of 0.010%), Immigrants from Israel (97.6%, a difference of 0.010%), Alsatian (97.6%, a difference of 0.010%), Ute (97.7%, a difference of 0.020%), and Hopi (97.7%, a difference of 0.020%).
| Demographics | Rating | Rank | 4th Grade |
| Immigrants | Moldova | 82.4 /100 | #145 | Excellent 97.7% |
| Jordanians | 81.3 /100 | #146 | Excellent 97.7% |
| Ute | 80.6 /100 | #147 | Excellent 97.7% |
| Hopi | 80.6 /100 | #148 | Excellent 97.7% |
| Soviet Union | 77.8 /100 | #149 | Good 97.6% |
| Immigrants | Israel | 77.7 /100 | #150 | Good 97.6% |
| Alsatians | 77.2 /100 | #151 | Good 97.6% |
| Immigrants | South Central Asia | 76.2 /100 | #152 | Good 97.6% |
| Immigrants | Eastern Europe | 71.3 /100 | #153 | Good 97.6% |
| Immigrants | Russia | 67.0 /100 | #154 | Good 97.6% |
| Albanians | 67.0 /100 | #155 | Good 97.6% |
| Immigrants | Jordan | 66.9 /100 | #156 | Good 97.6% |
| Immigrants | Bosnia and Herzegovina | 66.0 /100 | #157 | Good 97.6% |
| French American Indians | 65.9 /100 | #158 | Good 97.6% |
| Immigrants | Italy | 63.7 /100 | #159 | Good 97.6% |