Immigrants from Bolivia vs Immigrants from Somalia 4th Grade
COMPARE
Immigrants from Bolivia
Immigrants from Somalia
4th Grade
4th Grade Comparison
Immigrants from Bolivia
Immigrants from Somalia
96.9%
4TH GRADE
0.1/ 100
METRIC RATING
278th/ 347
METRIC RANK
96.5%
4TH GRADE
0.0/ 100
METRIC RATING
297th/ 347
METRIC RANK
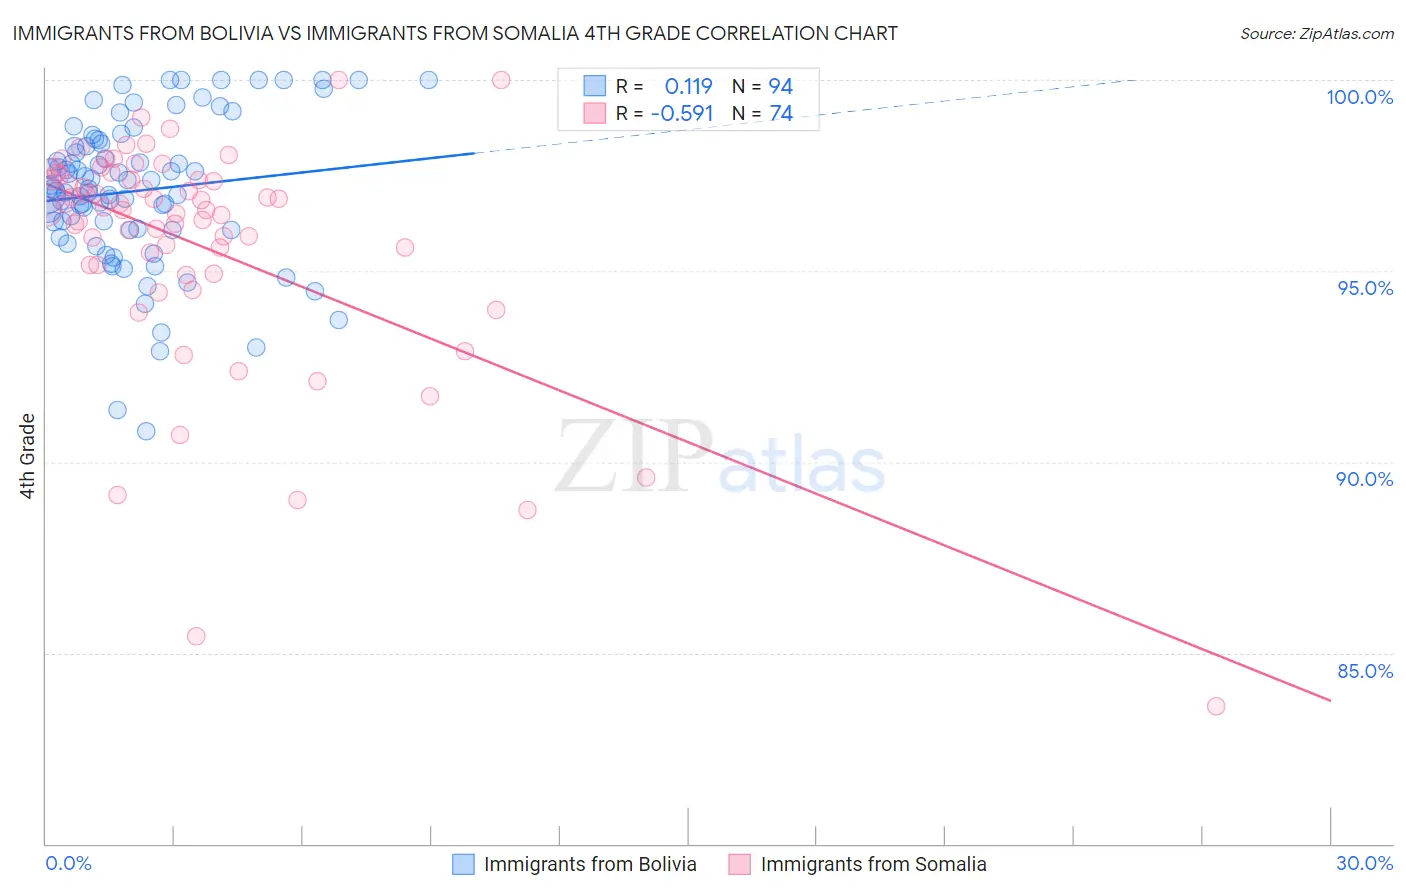
Immigrants from Bolivia vs Immigrants from Somalia 4th Grade Correlation Chart
The statistical analysis conducted on geographies consisting of 158,719,812 people shows a poor positive correlation between the proportion of Immigrants from Bolivia and percentage of population with at least 4th grade education in the United States with a correlation coefficient (R) of 0.119 and weighted average of 96.9%. Similarly, the statistical analysis conducted on geographies consisting of 92,108,376 people shows a substantial negative correlation between the proportion of Immigrants from Somalia and percentage of population with at least 4th grade education in the United States with a correlation coefficient (R) of -0.591 and weighted average of 96.5%, a difference of 0.34%.
4th Grade Correlation Summary
| Measurement | Immigrants from Bolivia | Immigrants from Somalia |
| Minimum | 90.8% | 83.6% |
| Maximum | 100.0% | 100.0% |
| Range | 9.2% | 16.4% |
| Mean | 97.1% | 95.7% |
| Median | 97.2% | 96.6% |
| Interquartile 25% (IQ1) | 96.1% | 95.2% |
| Interquartile 75% (IQ3) | 98.3% | 97.4% |
| Interquartile Range (IQR) | 2.3% | 2.2% |
| Standard Deviation (Sample) | 1.9% | 3.1% |
| Standard Deviation (Population) | 1.9% | 3.0% |
Demographics Similar to Immigrants from Bolivia and Immigrants from Somalia by 4th Grade
In terms of 4th grade, the demographic groups most similar to Immigrants from Bolivia are Immigrants from Western Africa (96.9%, a difference of 0.0%), Afghan (96.9%, a difference of 0.010%), Barbadian (96.9%, a difference of 0.020%), Immigrants from Hong Kong (96.9%, a difference of 0.030%), and Immigrants from Trinidad and Tobago (96.8%, a difference of 0.030%). Similarly, the demographic groups most similar to Immigrants from Somalia are Somali (96.6%, a difference of 0.090%), Immigrants from Portugal (96.6%, a difference of 0.10%), Immigrants from Eritrea (96.7%, a difference of 0.12%), Puerto Rican (96.7%, a difference of 0.14%), and Malaysian (96.7%, a difference of 0.15%).
| Demographics | Rating | Rank | 4th Grade |
| Immigrants | Western Africa | 0.1 /100 | #277 | Tragic 96.9% |
| Immigrants | Bolivia | 0.1 /100 | #278 | Tragic 96.9% |
| Afghans | 0.1 /100 | #279 | Tragic 96.9% |
| Barbadians | 0.1 /100 | #280 | Tragic 96.9% |
| Immigrants | Hong Kong | 0.1 /100 | #281 | Tragic 96.9% |
| Immigrants | Trinidad and Tobago | 0.1 /100 | #282 | Tragic 96.8% |
| Immigrants | Philippines | 0.1 /100 | #283 | Tragic 96.8% |
| Immigrants | St. Vincent and the Grenadines | 0.1 /100 | #284 | Tragic 96.8% |
| Immigrants | Barbados | 0.0 /100 | #285 | Tragic 96.8% |
| Immigrants | Thailand | 0.0 /100 | #286 | Tragic 96.8% |
| Houma | 0.0 /100 | #287 | Tragic 96.8% |
| Immigrants | Afghanistan | 0.0 /100 | #288 | Tragic 96.8% |
| Immigrants | West Indies | 0.0 /100 | #289 | Tragic 96.7% |
| British West Indians | 0.0 /100 | #290 | Tragic 96.7% |
| Immigrants | Grenada | 0.0 /100 | #291 | Tragic 96.7% |
| Malaysians | 0.0 /100 | #292 | Tragic 96.7% |
| Puerto Ricans | 0.0 /100 | #293 | Tragic 96.7% |
| Immigrants | Eritrea | 0.0 /100 | #294 | Tragic 96.7% |
| Immigrants | Portugal | 0.0 /100 | #295 | Tragic 96.6% |
| Somalis | 0.0 /100 | #296 | Tragic 96.6% |
| Immigrants | Somalia | 0.0 /100 | #297 | Tragic 96.5% |