Immigrants from Bolivia vs Immigrants from South Central Asia Unemployment Among Ages 55 to 59 years
COMPARE
Immigrants from Bolivia
Immigrants from South Central Asia
Unemployment Among Ages 55 to 59 years
Unemployment Among Ages 55 to 59 years Comparison
Immigrants from Bolivia
Immigrants from South Central Asia
4.2%
UNEMPLOYMENT AMONG AGES 55 TO 59 YEARS
100.0/ 100
METRIC RATING
5th/ 347
METRIC RANK
4.6%
UNEMPLOYMENT AMONG AGES 55 TO 59 YEARS
99.3/ 100
METRIC RATING
63rd/ 347
METRIC RANK
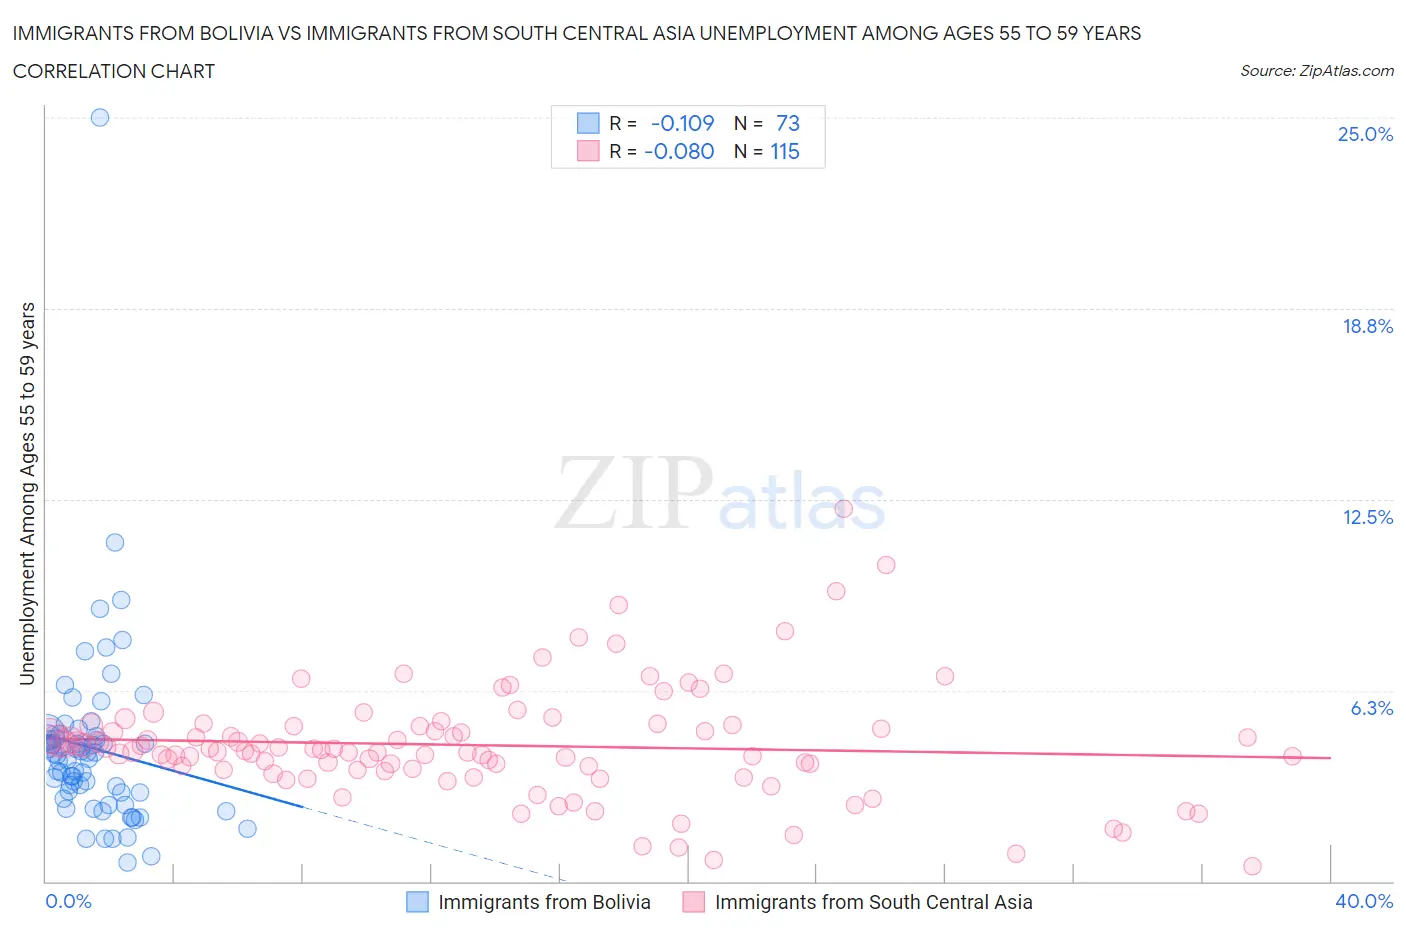
Immigrants from Bolivia vs Immigrants from South Central Asia Unemployment Among Ages 55 to 59 years Correlation Chart
The statistical analysis conducted on geographies consisting of 154,662,666 people shows a poor negative correlation between the proportion of Immigrants from Bolivia and unemployment rate among population between the ages 55 and 59 in the United States with a correlation coefficient (R) of -0.109 and weighted average of 4.2%. Similarly, the statistical analysis conducted on geographies consisting of 432,698,283 people shows a slight negative correlation between the proportion of Immigrants from South Central Asia and unemployment rate among population between the ages 55 and 59 in the United States with a correlation coefficient (R) of -0.080 and weighted average of 4.6%, a difference of 9.4%.
Unemployment Among Ages 55 to 59 years Correlation Summary
| Measurement | Immigrants from Bolivia | Immigrants from South Central Asia |
| Minimum | 0.60% | 0.50% |
| Maximum | 25.0% | 12.2% |
| Range | 24.4% | 11.7% |
| Mean | 4.4% | 4.4% |
| Median | 4.1% | 4.3% |
| Interquartile 25% (IQ1) | 2.8% | 3.6% |
| Interquartile 75% (IQ3) | 4.7% | 5.1% |
| Interquartile Range (IQR) | 1.9% | 1.4% |
| Standard Deviation (Sample) | 3.1% | 1.9% |
| Standard Deviation (Population) | 3.1% | 1.8% |
Similar Demographics by Unemployment Among Ages 55 to 59 years
Demographics Similar to Immigrants from Bolivia by Unemployment Among Ages 55 to 59 years
In terms of unemployment among ages 55 to 59 years, the demographic groups most similar to Immigrants from Bolivia are Venezuelan (4.2%, a difference of 0.54%), Norwegian (4.2%, a difference of 0.58%), Zimbabwean (4.2%, a difference of 1.1%), Bolivian (4.2%, a difference of 1.3%), and Cuban (4.2%, a difference of 1.4%).
| Demographics | Rating | Rank | Unemployment Among Ages 55 to 59 years |
| Fijians | 100.0 /100 | #1 | Exceptional 4.1% |
| Immigrants | Cuba | 100.0 /100 | #2 | Exceptional 4.1% |
| Immigrants | Venezuela | 100.0 /100 | #3 | Exceptional 4.1% |
| Venezuelans | 100.0 /100 | #4 | Exceptional 4.2% |
| Immigrants | Bolivia | 100.0 /100 | #5 | Exceptional 4.2% |
| Norwegians | 100.0 /100 | #6 | Exceptional 4.2% |
| Zimbabweans | 100.0 /100 | #7 | Exceptional 4.2% |
| Bolivians | 100.0 /100 | #8 | Exceptional 4.2% |
| Cubans | 100.0 /100 | #9 | Exceptional 4.2% |
| Tongans | 100.0 /100 | #10 | Exceptional 4.3% |
| Immigrants | Congo | 100.0 /100 | #11 | Exceptional 4.3% |
| Danes | 100.0 /100 | #12 | Exceptional 4.3% |
| Indonesians | 100.0 /100 | #13 | Exceptional 4.3% |
| Immigrants | India | 100.0 /100 | #14 | Exceptional 4.3% |
| Bulgarians | 100.0 /100 | #15 | Exceptional 4.3% |
Demographics Similar to Immigrants from South Central Asia by Unemployment Among Ages 55 to 59 years
In terms of unemployment among ages 55 to 59 years, the demographic groups most similar to Immigrants from South Central Asia are Slovene (4.6%, a difference of 0.080%), Argentinean (4.6%, a difference of 0.18%), Sudanese (4.6%, a difference of 0.19%), Immigrants from Argentina (4.6%, a difference of 0.33%), and Mongolian (4.6%, a difference of 0.33%).
| Demographics | Rating | Rank | Unemployment Among Ages 55 to 59 years |
| Welsh | 99.6 /100 | #56 | Exceptional 4.5% |
| Northern Europeans | 99.6 /100 | #57 | Exceptional 4.5% |
| Okinawans | 99.6 /100 | #58 | Exceptional 4.5% |
| Immigrants | Uganda | 99.5 /100 | #59 | Exceptional 4.6% |
| Dutch | 99.5 /100 | #60 | Exceptional 4.6% |
| Immigrants | Argentina | 99.5 /100 | #61 | Exceptional 4.6% |
| Slovenes | 99.3 /100 | #62 | Exceptional 4.6% |
| Immigrants | South Central Asia | 99.3 /100 | #63 | Exceptional 4.6% |
| Argentineans | 99.1 /100 | #64 | Exceptional 4.6% |
| Sudanese | 99.1 /100 | #65 | Exceptional 4.6% |
| Mongolians | 99.0 /100 | #66 | Exceptional 4.6% |
| Ugandans | 99.0 /100 | #67 | Exceptional 4.6% |
| Immigrants | Micronesia | 99.0 /100 | #68 | Exceptional 4.6% |
| Czechoslovakians | 99.0 /100 | #69 | Exceptional 4.6% |
| Filipinos | 98.8 /100 | #70 | Exceptional 4.6% |