Immigrants from Belize vs Immigrants from Sweden Unemployment Among Ages 16 to 19 years
COMPARE
Immigrants from Belize
Immigrants from Sweden
Unemployment Among Ages 16 to 19 years
Unemployment Among Ages 16 to 19 years Comparison
Immigrants from Belize
Immigrants from Sweden
22.2%
UNEMPLOYMENT AMONG AGES 16 TO 19 YEARS
0.0/ 100
METRIC RATING
317th/ 347
METRIC RANK
17.6%
UNEMPLOYMENT AMONG AGES 16 TO 19 YEARS
49.1/ 100
METRIC RATING
175th/ 347
METRIC RANK
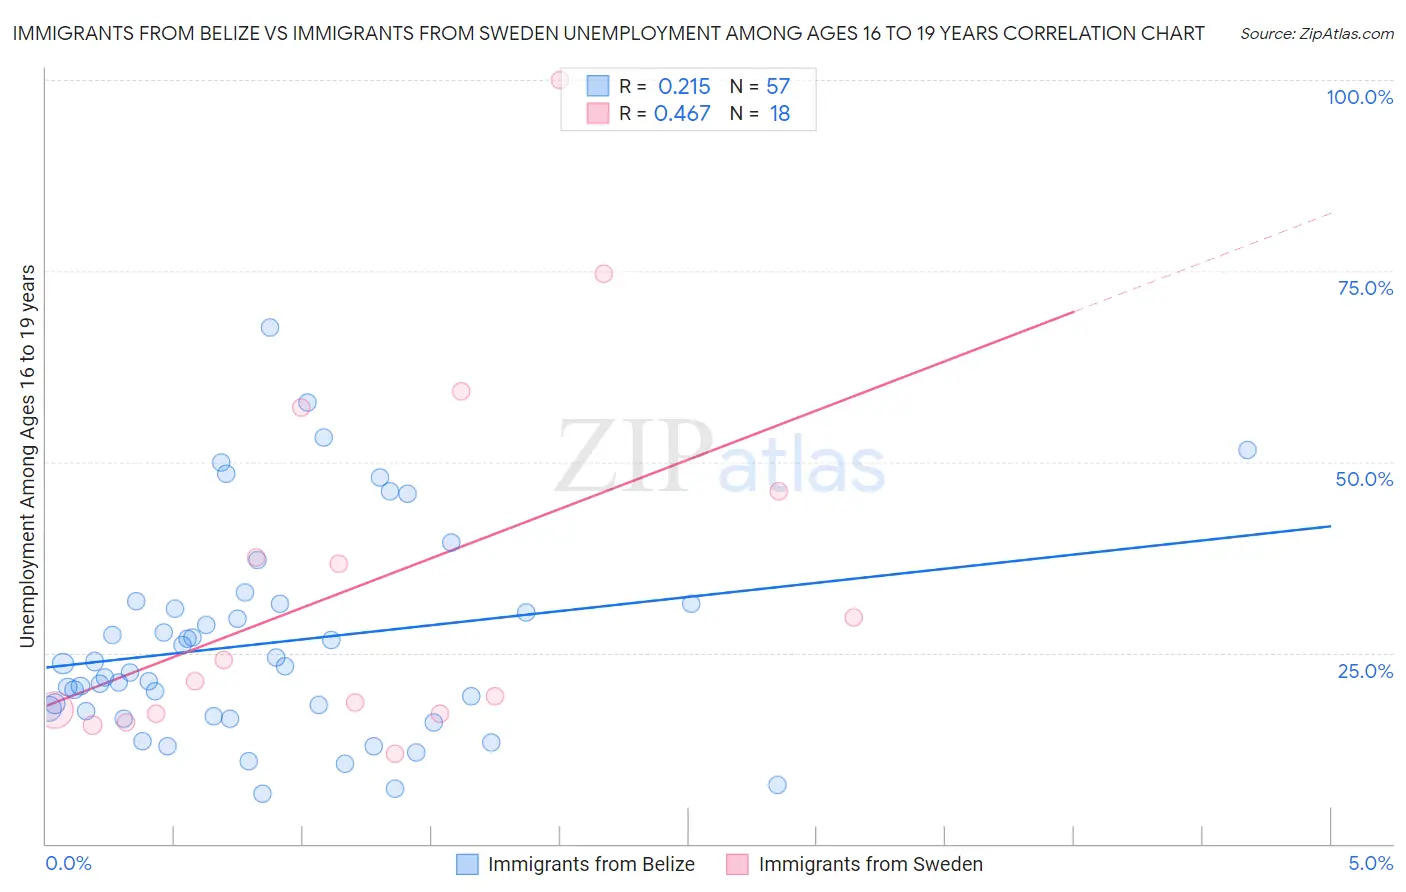
Immigrants from Belize vs Immigrants from Sweden Unemployment Among Ages 16 to 19 years Correlation Chart
The statistical analysis conducted on geographies consisting of 128,436,960 people shows a weak positive correlation between the proportion of Immigrants from Belize and unemployment rate among population between the ages 16 and 19 in the United States with a correlation coefficient (R) of 0.215 and weighted average of 22.2%. Similarly, the statistical analysis conducted on geographies consisting of 159,357,734 people shows a moderate positive correlation between the proportion of Immigrants from Sweden and unemployment rate among population between the ages 16 and 19 in the United States with a correlation coefficient (R) of 0.467 and weighted average of 17.6%, a difference of 26.0%.
Unemployment Among Ages 16 to 19 years Correlation Summary
| Measurement | Immigrants from Belize | Immigrants from Sweden |
| Minimum | 6.5% | 11.8% |
| Maximum | 67.6% | 100.0% |
| Range | 61.1% | 88.2% |
| Mean | 26.3% | 34.4% |
| Median | 23.3% | 22.7% |
| Interquartile 25% (IQ1) | 17.0% | 17.1% |
| Interquartile 75% (IQ3) | 31.5% | 46.2% |
| Interquartile Range (IQR) | 14.5% | 29.1% |
| Standard Deviation (Sample) | 13.6% | 24.4% |
| Standard Deviation (Population) | 13.5% | 23.7% |
Similar Demographics by Unemployment Among Ages 16 to 19 years
Demographics Similar to Immigrants from Belize by Unemployment Among Ages 16 to 19 years
In terms of unemployment among ages 16 to 19 years, the demographic groups most similar to Immigrants from Belize are Immigrants from Jamaica (22.2%, a difference of 0.15%), Immigrants from West Indies (22.2%, a difference of 0.31%), Tohono O'odham (22.1%, a difference of 0.45%), Cheyenne (22.3%, a difference of 0.54%), and Immigrants from Dominica (21.9%, a difference of 0.99%).
| Demographics | Rating | Rank | Unemployment Among Ages 16 to 19 years |
| Vietnamese | 0.0 /100 | #310 | Tragic 21.5% |
| Belizeans | 0.0 /100 | #311 | Tragic 21.6% |
| Houma | 0.0 /100 | #312 | Tragic 21.6% |
| Jamaicans | 0.0 /100 | #313 | Tragic 21.7% |
| Alaska Natives | 0.0 /100 | #314 | Tragic 21.8% |
| Immigrants | Dominica | 0.0 /100 | #315 | Tragic 21.9% |
| Tohono O'odham | 0.0 /100 | #316 | Tragic 22.1% |
| Immigrants | Belize | 0.0 /100 | #317 | Tragic 22.2% |
| Immigrants | Jamaica | 0.0 /100 | #318 | Tragic 22.2% |
| Immigrants | West Indies | 0.0 /100 | #319 | Tragic 22.2% |
| Cheyenne | 0.0 /100 | #320 | Tragic 22.3% |
| West Indians | 0.0 /100 | #321 | Tragic 22.4% |
| Barbadians | 0.0 /100 | #322 | Tragic 22.5% |
| Yakama | 0.0 /100 | #323 | Tragic 22.5% |
| Immigrants | Armenia | 0.0 /100 | #324 | Tragic 22.6% |
Demographics Similar to Immigrants from Sweden by Unemployment Among Ages 16 to 19 years
In terms of unemployment among ages 16 to 19 years, the demographic groups most similar to Immigrants from Sweden are Nicaraguan (17.6%, a difference of 0.010%), Bermudan (17.6%, a difference of 0.020%), Celtic (17.6%, a difference of 0.020%), Osage (17.6%, a difference of 0.040%), and Chilean (17.6%, a difference of 0.080%).
| Demographics | Rating | Rank | Unemployment Among Ages 16 to 19 years |
| Immigrants | Hungary | 54.7 /100 | #168 | Average 17.5% |
| Immigrants | Cambodia | 54.5 /100 | #169 | Average 17.5% |
| Immigrants | Romania | 53.3 /100 | #170 | Average 17.5% |
| Immigrants | Switzerland | 53.2 /100 | #171 | Average 17.5% |
| Immigrants | Western Europe | 52.2 /100 | #172 | Average 17.6% |
| Chileans | 50.8 /100 | #173 | Average 17.6% |
| Osage | 50.0 /100 | #174 | Average 17.6% |
| Immigrants | Sweden | 49.1 /100 | #175 | Average 17.6% |
| Nicaraguans | 48.9 /100 | #176 | Average 17.6% |
| Bermudans | 48.7 /100 | #177 | Average 17.6% |
| Celtics | 48.7 /100 | #178 | Average 17.6% |
| Americans | 47.4 /100 | #179 | Average 17.6% |
| Spaniards | 47.1 /100 | #180 | Average 17.6% |
| Immigrants | Turkey | 45.6 /100 | #181 | Average 17.6% |
| Russians | 45.2 /100 | #182 | Average 17.6% |