Immigrants from Belarus vs Immigrants from Central America 2nd Grade
COMPARE
Immigrants from Belarus
Immigrants from Central America
2nd Grade
2nd Grade Comparison
Immigrants from Belarus
Immigrants from Central America
97.8%
2ND GRADE
41.5/ 100
METRIC RATING
184th/ 347
METRIC RANK
96.2%
2ND GRADE
0.0/ 100
METRIC RATING
341st/ 347
METRIC RANK
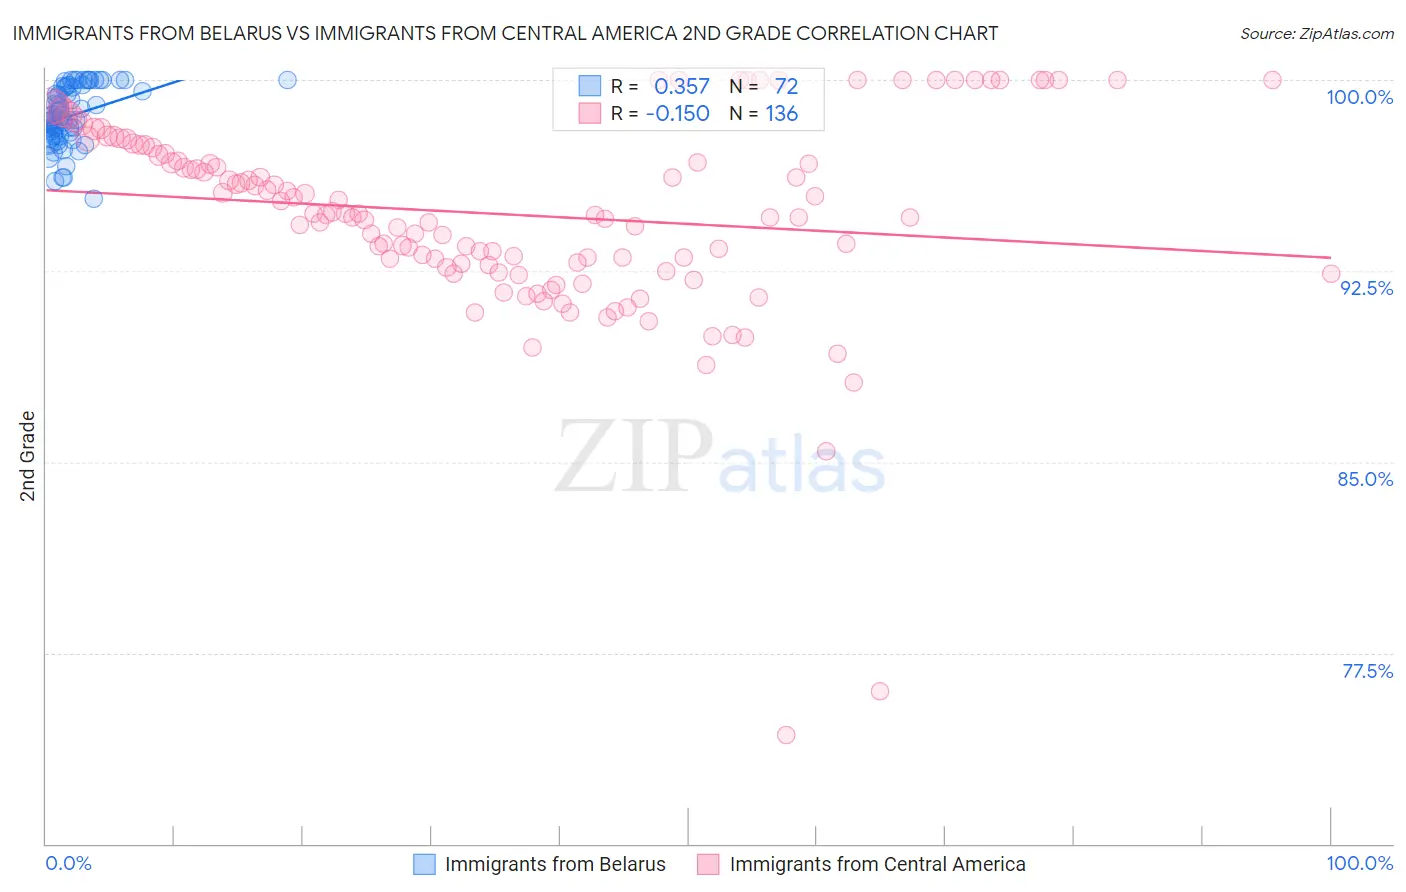
Immigrants from Belarus vs Immigrants from Central America 2nd Grade Correlation Chart
The statistical analysis conducted on geographies consisting of 149,993,317 people shows a mild positive correlation between the proportion of Immigrants from Belarus and percentage of population with at least 2nd grade education in the United States with a correlation coefficient (R) of 0.357 and weighted average of 97.8%. Similarly, the statistical analysis conducted on geographies consisting of 536,554,221 people shows a poor negative correlation between the proportion of Immigrants from Central America and percentage of population with at least 2nd grade education in the United States with a correlation coefficient (R) of -0.150 and weighted average of 96.2%, a difference of 1.7%.
2nd Grade Correlation Summary
| Measurement | Immigrants from Belarus | Immigrants from Central America |
| Minimum | 95.4% | 74.3% |
| Maximum | 100.0% | 100.0% |
| Range | 4.6% | 25.7% |
| Mean | 98.6% | 94.7% |
| Median | 98.5% | 94.7% |
| Interquartile 25% (IQ1) | 97.8% | 92.8% |
| Interquartile 75% (IQ3) | 99.7% | 97.4% |
| Interquartile Range (IQR) | 1.9% | 4.6% |
| Standard Deviation (Sample) | 1.1% | 3.9% |
| Standard Deviation (Population) | 1.1% | 3.9% |
Similar Demographics by 2nd Grade
Demographics Similar to Immigrants from Belarus by 2nd Grade
In terms of 2nd grade, the demographic groups most similar to Immigrants from Belarus are Portuguese (97.8%, a difference of 0.0%), Immigrants from Poland (97.8%, a difference of 0.0%), Immigrants from Argentina (97.8%, a difference of 0.0%), Immigrants from Venezuela (97.9%, a difference of 0.010%), and Native/Alaskan (97.9%, a difference of 0.010%).
| Demographics | Rating | Rank | 2nd Grade |
| Immigrants | Brazil | 46.6 /100 | #177 | Average 97.9% |
| Argentineans | 46.3 /100 | #178 | Average 97.9% |
| Immigrants | Venezuela | 46.1 /100 | #179 | Average 97.9% |
| Natives/Alaskans | 44.3 /100 | #180 | Average 97.9% |
| Egyptians | 44.3 /100 | #181 | Average 97.9% |
| Portuguese | 42.4 /100 | #182 | Average 97.8% |
| Immigrants | Poland | 42.2 /100 | #183 | Average 97.8% |
| Immigrants | Belarus | 41.5 /100 | #184 | Average 97.8% |
| Immigrants | Argentina | 40.6 /100 | #185 | Average 97.8% |
| Arabs | 36.9 /100 | #186 | Fair 97.8% |
| Pakistanis | 36.1 /100 | #187 | Fair 97.8% |
| Immigrants | Kazakhstan | 35.6 /100 | #188 | Fair 97.8% |
| Panamanians | 33.5 /100 | #189 | Fair 97.8% |
| Immigrants | Taiwan | 31.8 /100 | #190 | Fair 97.8% |
| Paraguayans | 30.8 /100 | #191 | Fair 97.8% |
Demographics Similar to Immigrants from Central America by 2nd Grade
In terms of 2nd grade, the demographic groups most similar to Immigrants from Central America are Immigrants from Guatemala (96.2%, a difference of 0.010%), Immigrants from Mexico (96.1%, a difference of 0.030%), Nepalese (96.1%, a difference of 0.11%), Guatemalan (96.3%, a difference of 0.15%), and Salvadoran (96.0%, a difference of 0.15%).
| Demographics | Rating | Rank | 2nd Grade |
| Immigrants | Dominican Republic | 0.0 /100 | #333 | Tragic 96.4% |
| Central Americans | 0.0 /100 | #334 | Tragic 96.4% |
| Yakama | 0.0 /100 | #335 | Tragic 96.4% |
| Immigrants | Fiji | 0.0 /100 | #336 | Tragic 96.4% |
| Immigrants | Cambodia | 0.0 /100 | #337 | Tragic 96.4% |
| Immigrants | Cabo Verde | 0.0 /100 | #338 | Tragic 96.3% |
| Guatemalans | 0.0 /100 | #339 | Tragic 96.3% |
| Immigrants | Guatemala | 0.0 /100 | #340 | Tragic 96.2% |
| Immigrants | Central America | 0.0 /100 | #341 | Tragic 96.2% |
| Immigrants | Mexico | 0.0 /100 | #342 | Tragic 96.1% |
| Nepalese | 0.0 /100 | #343 | Tragic 96.1% |
| Salvadorans | 0.0 /100 | #344 | Tragic 96.0% |
| Immigrants | El Salvador | 0.0 /100 | #345 | Tragic 95.9% |
| Immigrants | Yemen | 0.0 /100 | #346 | Tragic 95.7% |
| Spanish American Indians | 0.0 /100 | #347 | Tragic 95.6% |