Immigrants from Ghana vs Mexican 5th Grade
COMPARE
Immigrants from Ghana
Mexican
5th Grade
5th Grade Comparison
Immigrants from Ghana
Mexicans
96.6%
5TH GRADE
0.1/ 100
METRIC RATING
278th/ 347
METRIC RANK
95.2%
5TH GRADE
0.0/ 100
METRIC RATING
335th/ 347
METRIC RANK
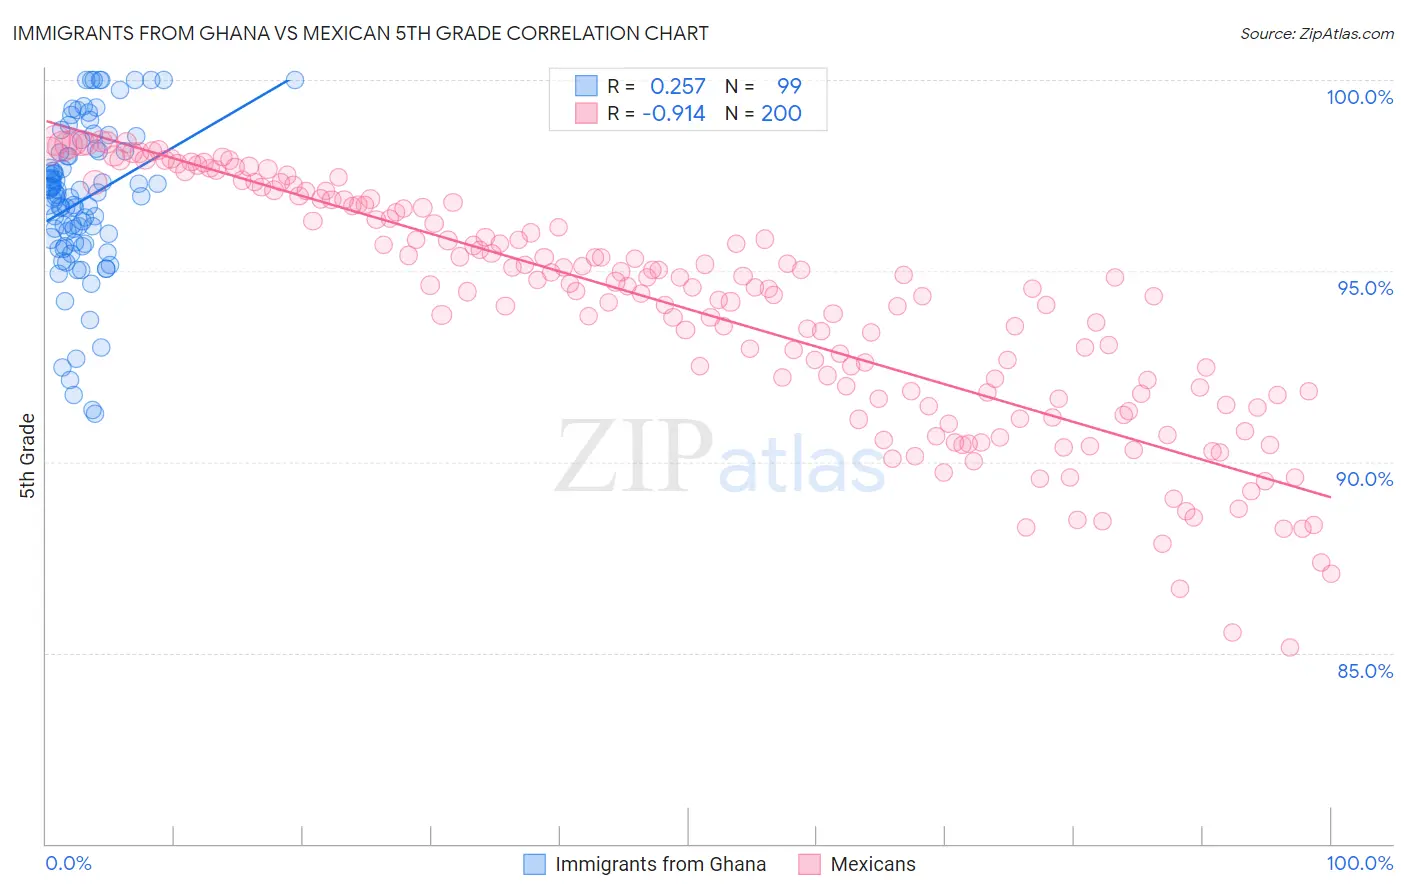
Immigrants from Ghana vs Mexican 5th Grade Correlation Chart
The statistical analysis conducted on geographies consisting of 199,952,023 people shows a weak positive correlation between the proportion of Immigrants from Ghana and percentage of population with at least 5th grade education in the United States with a correlation coefficient (R) of 0.257 and weighted average of 96.6%. Similarly, the statistical analysis conducted on geographies consisting of 565,340,290 people shows a near-perfect negative correlation between the proportion of Mexicans and percentage of population with at least 5th grade education in the United States with a correlation coefficient (R) of -0.914 and weighted average of 95.2%, a difference of 1.5%.
5th Grade Correlation Summary
| Measurement | Immigrants from Ghana | Mexican |
| Minimum | 91.2% | 85.1% |
| Maximum | 100.0% | 98.4% |
| Range | 8.8% | 13.3% |
| Mean | 96.9% | 94.0% |
| Median | 97.0% | 94.6% |
| Interquartile 25% (IQ1) | 95.7% | 91.7% |
| Interquartile 75% (IQ3) | 98.1% | 96.7% |
| Interquartile Range (IQR) | 2.4% | 5.1% |
| Standard Deviation (Sample) | 2.0% | 3.1% |
| Standard Deviation (Population) | 2.0% | 3.1% |
Similar Demographics by 5th Grade
Demographics Similar to Immigrants from Ghana by 5th Grade
In terms of 5th grade, the demographic groups most similar to Immigrants from Ghana are Immigrants from Peru (96.6%, a difference of 0.010%), Cuban (96.6%, a difference of 0.010%), Immigrants from Bolivia (96.6%, a difference of 0.010%), Immigrants from Philippines (96.6%, a difference of 0.010%), and Yaqui (96.7%, a difference of 0.020%).
| Demographics | Rating | Rank | 5th Grade |
| Immigrants | Hong Kong | 0.2 /100 | #271 | Tragic 96.7% |
| Trinidadians and Tobagonians | 0.1 /100 | #272 | Tragic 96.7% |
| Yaqui | 0.1 /100 | #273 | Tragic 96.7% |
| Immigrants | Cameroon | 0.1 /100 | #274 | Tragic 96.7% |
| Immigrants | Peru | 0.1 /100 | #275 | Tragic 96.6% |
| Cubans | 0.1 /100 | #276 | Tragic 96.6% |
| Immigrants | Bolivia | 0.1 /100 | #277 | Tragic 96.6% |
| Immigrants | Ghana | 0.1 /100 | #278 | Tragic 96.6% |
| Immigrants | Philippines | 0.1 /100 | #279 | Tragic 96.6% |
| Immigrants | Western Africa | 0.1 /100 | #280 | Tragic 96.6% |
| Houma | 0.1 /100 | #281 | Tragic 96.6% |
| Barbadians | 0.1 /100 | #282 | Tragic 96.6% |
| Fijians | 0.1 /100 | #283 | Tragic 96.6% |
| Immigrants | Trinidad and Tobago | 0.1 /100 | #284 | Tragic 96.6% |
| Immigrants | St. Vincent and the Grenadines | 0.1 /100 | #285 | Tragic 96.6% |
Demographics Similar to Mexicans by 5th Grade
In terms of 5th grade, the demographic groups most similar to Mexicans are Nepalese (95.2%, a difference of 0.030%), Immigrants from Latin America (95.3%, a difference of 0.050%), Immigrants from Dominican Republic (95.3%, a difference of 0.060%), Immigrants from the Azores (95.1%, a difference of 0.10%), and Immigrants from Honduras (95.4%, a difference of 0.16%).
| Demographics | Rating | Rank | 5th Grade |
| Cape Verdeans | 0.0 /100 | #328 | Tragic 95.5% |
| Mexican American Indians | 0.0 /100 | #329 | Tragic 95.5% |
| Immigrants | Armenia | 0.0 /100 | #330 | Tragic 95.4% |
| Immigrants | Honduras | 0.0 /100 | #331 | Tragic 95.4% |
| Immigrants | Dominican Republic | 0.0 /100 | #332 | Tragic 95.3% |
| Immigrants | Latin America | 0.0 /100 | #333 | Tragic 95.3% |
| Nepalese | 0.0 /100 | #334 | Tragic 95.2% |
| Mexicans | 0.0 /100 | #335 | Tragic 95.2% |
| Immigrants | Azores | 0.0 /100 | #336 | Tragic 95.1% |
| Central Americans | 0.0 /100 | #337 | Tragic 95.1% |
| Immigrants | Cabo Verde | 0.0 /100 | #338 | Tragic 94.9% |
| Immigrants | Yemen | 0.0 /100 | #339 | Tragic 94.9% |
| Guatemalans | 0.0 /100 | #340 | Tragic 94.8% |
| Yakama | 0.0 /100 | #341 | Tragic 94.8% |
| Immigrants | Central America | 0.0 /100 | #342 | Tragic 94.7% |