New Zealander vs Finnish Nursery School
COMPARE
New Zealander
Finnish
Nursery School
Nursery School Comparison
New Zealanders
Finns
98.4%
NURSERY SCHOOL
99.7/ 100
METRIC RATING
61st/ 347
METRIC RANK
98.6%
NURSERY SCHOOL
100.0/ 100
METRIC RATING
21st/ 347
METRIC RANK
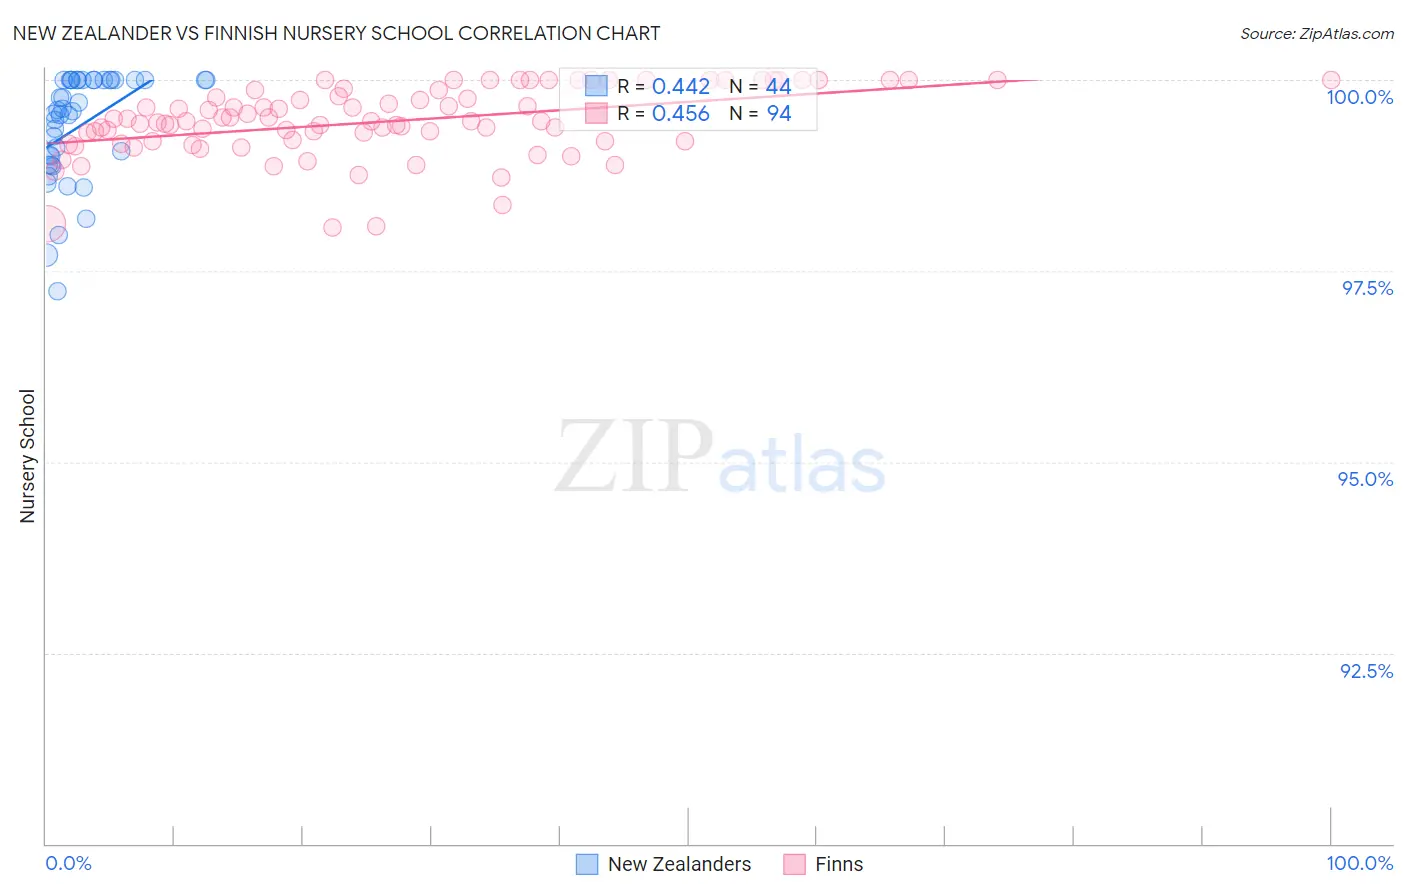
New Zealander vs Finnish Nursery School Correlation Chart
The statistical analysis conducted on geographies consisting of 106,905,567 people shows a moderate positive correlation between the proportion of New Zealanders and percentage of population with at least nursery school education in the United States with a correlation coefficient (R) of 0.442 and weighted average of 98.4%. Similarly, the statistical analysis conducted on geographies consisting of 404,675,516 people shows a moderate positive correlation between the proportion of Finns and percentage of population with at least nursery school education in the United States with a correlation coefficient (R) of 0.456 and weighted average of 98.6%, a difference of 0.21%.
Nursery School Correlation Summary
| Measurement | New Zealander | Finnish |
| Minimum | 97.2% | 98.1% |
| Maximum | 100.0% | 100.0% |
| Range | 2.8% | 1.9% |
| Mean | 99.4% | 99.5% |
| Median | 99.6% | 99.5% |
| Interquartile 25% (IQ1) | 98.9% | 99.2% |
| Interquartile 75% (IQ3) | 100.0% | 99.9% |
| Interquartile Range (IQR) | 1.1% | 0.67% |
| Standard Deviation (Sample) | 0.70% | 0.45% |
| Standard Deviation (Population) | 0.70% | 0.45% |
Similar Demographics by Nursery School
Demographics Similar to New Zealanders by Nursery School
In terms of nursery school, the demographic groups most similar to New Zealanders are Immigrants from Canada (98.4%, a difference of 0.0%), Slavic (98.4%, a difference of 0.0%), Creek (98.4%, a difference of 0.0%), Immigrants from North America (98.4%, a difference of 0.0%), and Greek (98.4%, a difference of 0.0%).
| Demographics | Rating | Rank | Nursery School |
| Pueblo | 99.8 /100 | #54 | Exceptional 98.4% |
| Immigrants | Scotland | 99.8 /100 | #55 | Exceptional 98.4% |
| Americans | 99.8 /100 | #56 | Exceptional 98.4% |
| Austrians | 99.8 /100 | #57 | Exceptional 98.4% |
| Bulgarians | 99.8 /100 | #58 | Exceptional 98.4% |
| Immigrants | Canada | 99.8 /100 | #59 | Exceptional 98.4% |
| Slavs | 99.8 /100 | #60 | Exceptional 98.4% |
| New Zealanders | 99.7 /100 | #61 | Exceptional 98.4% |
| Creek | 99.7 /100 | #62 | Exceptional 98.4% |
| Immigrants | North America | 99.7 /100 | #63 | Exceptional 98.4% |
| Greeks | 99.7 /100 | #64 | Exceptional 98.4% |
| Maltese | 99.7 /100 | #65 | Exceptional 98.4% |
| Canadians | 99.7 /100 | #66 | Exceptional 98.4% |
| Immigrants | Northern Europe | 99.6 /100 | #67 | Exceptional 98.4% |
| Russians | 99.6 /100 | #68 | Exceptional 98.4% |
Demographics Similar to Finns by Nursery School
In terms of nursery school, the demographic groups most similar to Finns are Pennsylvania German (98.6%, a difference of 0.0%), Lithuanian (98.6%, a difference of 0.0%), Polish (98.6%, a difference of 0.0%), Danish (98.6%, a difference of 0.0%), and Scotch-Irish (98.6%, a difference of 0.0%).
| Demographics | Rating | Rank | Nursery School |
| Carpatho Rusyns | 100.0 /100 | #14 | Exceptional 98.7% |
| Swedes | 100.0 /100 | #15 | Exceptional 98.7% |
| Scottish | 100.0 /100 | #16 | Exceptional 98.7% |
| Aleuts | 100.0 /100 | #17 | Exceptional 98.7% |
| Dutch | 100.0 /100 | #18 | Exceptional 98.7% |
| Irish | 100.0 /100 | #19 | Exceptional 98.6% |
| Pennsylvania Germans | 100.0 /100 | #20 | Exceptional 98.6% |
| Finns | 100.0 /100 | #21 | Exceptional 98.6% |
| Lithuanians | 100.0 /100 | #22 | Exceptional 98.6% |
| Poles | 100.0 /100 | #23 | Exceptional 98.6% |
| Danes | 100.0 /100 | #24 | Exceptional 98.6% |
| Scotch-Irish | 100.0 /100 | #25 | Exceptional 98.6% |
| Sioux | 100.0 /100 | #26 | Exceptional 98.6% |
| Arapaho | 100.0 /100 | #27 | Exceptional 98.6% |
| Croatians | 100.0 /100 | #28 | Exceptional 98.6% |