Immigrants from Bangladesh vs Spanish American Professional Degree
COMPARE
Immigrants from Bangladesh
Spanish American
Professional Degree
Professional Degree Comparison
Immigrants from Bangladesh
Spanish Americans
4.4%
PROFESSIONAL DEGREE
56.0/ 100
METRIC RATING
171st/ 347
METRIC RANK
3.9%
PROFESSIONAL DEGREE
3.8/ 100
METRIC RATING
236th/ 347
METRIC RANK
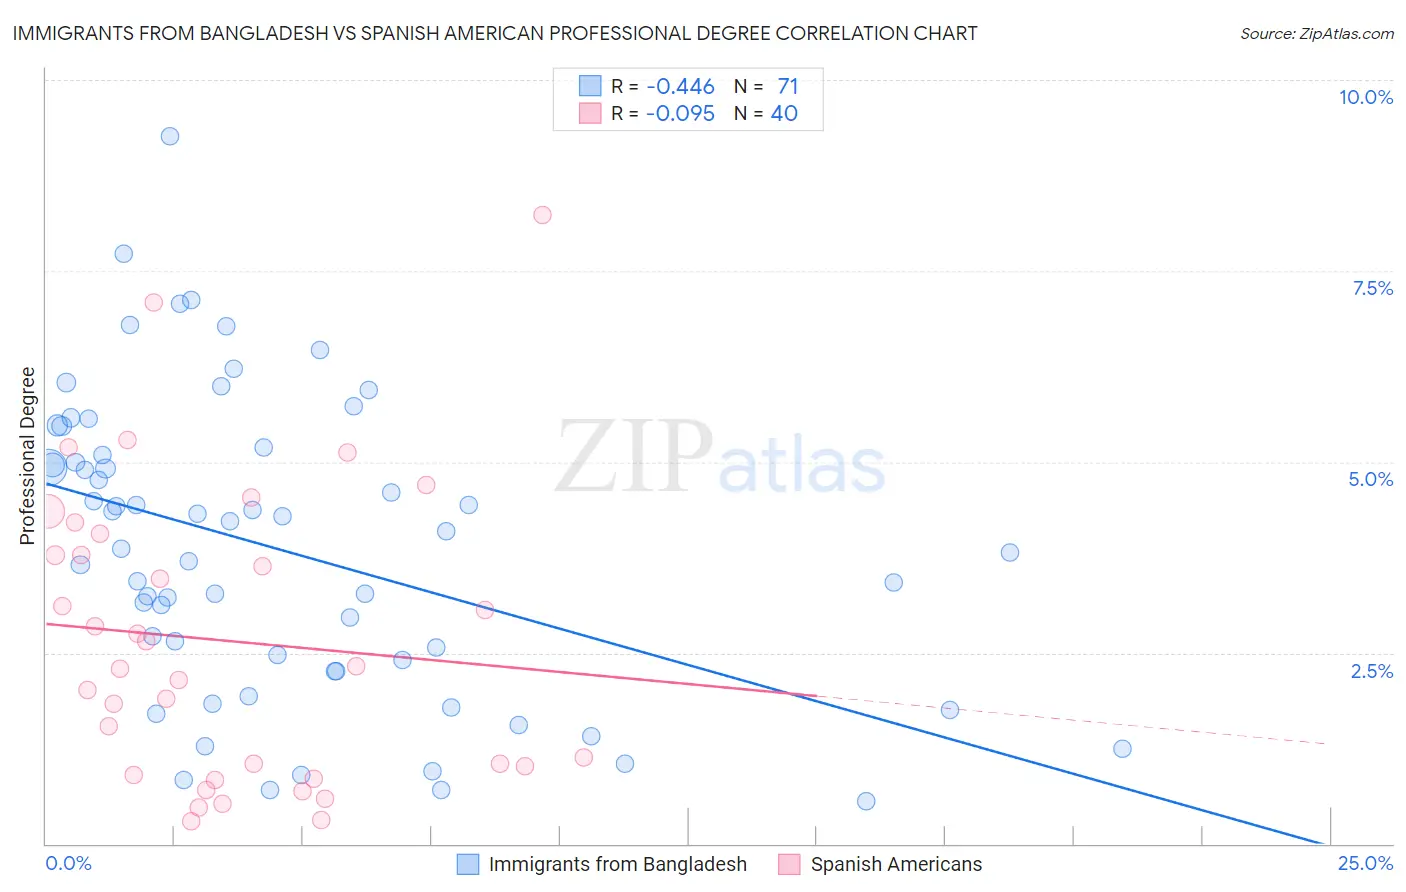
Immigrants from Bangladesh vs Spanish American Professional Degree Correlation Chart
The statistical analysis conducted on geographies consisting of 203,559,674 people shows a moderate negative correlation between the proportion of Immigrants from Bangladesh and percentage of population with at least professional degree education in the United States with a correlation coefficient (R) of -0.446 and weighted average of 4.4%. Similarly, the statistical analysis conducted on geographies consisting of 103,063,360 people shows a slight negative correlation between the proportion of Spanish Americans and percentage of population with at least professional degree education in the United States with a correlation coefficient (R) of -0.095 and weighted average of 3.9%, a difference of 14.2%.
Professional Degree Correlation Summary
| Measurement | Immigrants from Bangladesh | Spanish American |
| Minimum | 0.56% | 0.30% |
| Maximum | 9.3% | 8.2% |
| Range | 8.7% | 7.9% |
| Mean | 3.8% | 2.7% |
| Median | 3.9% | 2.3% |
| Interquartile 25% (IQ1) | 2.3% | 0.95% |
| Interquartile 75% (IQ3) | 5.1% | 3.9% |
| Interquartile Range (IQR) | 2.8% | 3.0% |
| Standard Deviation (Sample) | 1.9% | 1.9% |
| Standard Deviation (Population) | 1.9% | 1.9% |
Similar Demographics by Professional Degree
Demographics Similar to Immigrants from Bangladesh by Professional Degree
In terms of professional degree, the demographic groups most similar to Immigrants from Bangladesh are Immigrants from Zaire (4.5%, a difference of 0.22%), Chinese (4.5%, a difference of 0.39%), Immigrants from Sierra Leone (4.5%, a difference of 0.41%), Immigrants from Afghanistan (4.5%, a difference of 0.48%), and Immigrants from Colombia (4.5%, a difference of 0.51%).
| Demographics | Rating | Rank | Professional Degree |
| Swiss | 61.0 /100 | #164 | Good 4.5% |
| Costa Ricans | 59.9 /100 | #165 | Average 4.5% |
| Immigrants | Colombia | 59.4 /100 | #166 | Average 4.5% |
| Immigrants | Afghanistan | 59.2 /100 | #167 | Average 4.5% |
| Immigrants | Sierra Leone | 58.7 /100 | #168 | Average 4.5% |
| Chinese | 58.6 /100 | #169 | Average 4.5% |
| Immigrants | Zaire | 57.4 /100 | #170 | Average 4.5% |
| Immigrants | Bangladesh | 56.0 /100 | #171 | Average 4.4% |
| Spaniards | 52.0 /100 | #172 | Average 4.4% |
| English | 50.1 /100 | #173 | Average 4.4% |
| Kenyans | 50.0 /100 | #174 | Average 4.4% |
| Irish | 50.0 /100 | #175 | Average 4.4% |
| Immigrants | Peru | 49.3 /100 | #176 | Average 4.4% |
| Celtics | 47.6 /100 | #177 | Average 4.4% |
| Immigrants | Costa Rica | 46.7 /100 | #178 | Average 4.4% |
Demographics Similar to Spanish Americans by Professional Degree
In terms of professional degree, the demographic groups most similar to Spanish Americans are Immigrants from Trinidad and Tobago (3.9%, a difference of 0.070%), Immigrants from Barbados (3.9%, a difference of 0.22%), Nonimmigrants (3.9%, a difference of 0.23%), Immigrants from Philippines (3.9%, a difference of 0.28%), and Cree (3.9%, a difference of 0.53%).
| Demographics | Rating | Rank | Professional Degree |
| Immigrants | Burma/Myanmar | 5.4 /100 | #229 | Tragic 3.9% |
| Nicaraguans | 5.1 /100 | #230 | Tragic 3.9% |
| Ecuadorians | 4.6 /100 | #231 | Tragic 3.9% |
| Cree | 4.3 /100 | #232 | Tragic 3.9% |
| Immigrants | Philippines | 4.1 /100 | #233 | Tragic 3.9% |
| Immigrants | Nonimmigrants | 4.0 /100 | #234 | Tragic 3.9% |
| Immigrants | Barbados | 4.0 /100 | #235 | Tragic 3.9% |
| Spanish Americans | 3.8 /100 | #236 | Tragic 3.9% |
| Immigrants | Trinidad and Tobago | 3.8 /100 | #237 | Tragic 3.9% |
| Colville | 2.6 /100 | #238 | Tragic 3.8% |
| British West Indians | 2.4 /100 | #239 | Tragic 3.8% |
| Immigrants | Ecuador | 2.3 /100 | #240 | Tragic 3.8% |
| Alaskan Athabascans | 2.3 /100 | #241 | Tragic 3.8% |
| Native Hawaiians | 2.3 /100 | #242 | Tragic 3.8% |
| Guamanians/Chamorros | 2.2 /100 | #243 | Tragic 3.8% |