Immigrants from Bangladesh vs Sierra Leonean Master's Degree
COMPARE
Immigrants from Bangladesh
Sierra Leonean
Master's Degree
Master's Degree Comparison
Immigrants from Bangladesh
Sierra Leoneans
15.5%
MASTER'S DEGREE
76.1/ 100
METRIC RATING
155th/ 347
METRIC RANK
16.8%
MASTER'S DEGREE
98.0/ 100
METRIC RATING
108th/ 347
METRIC RANK
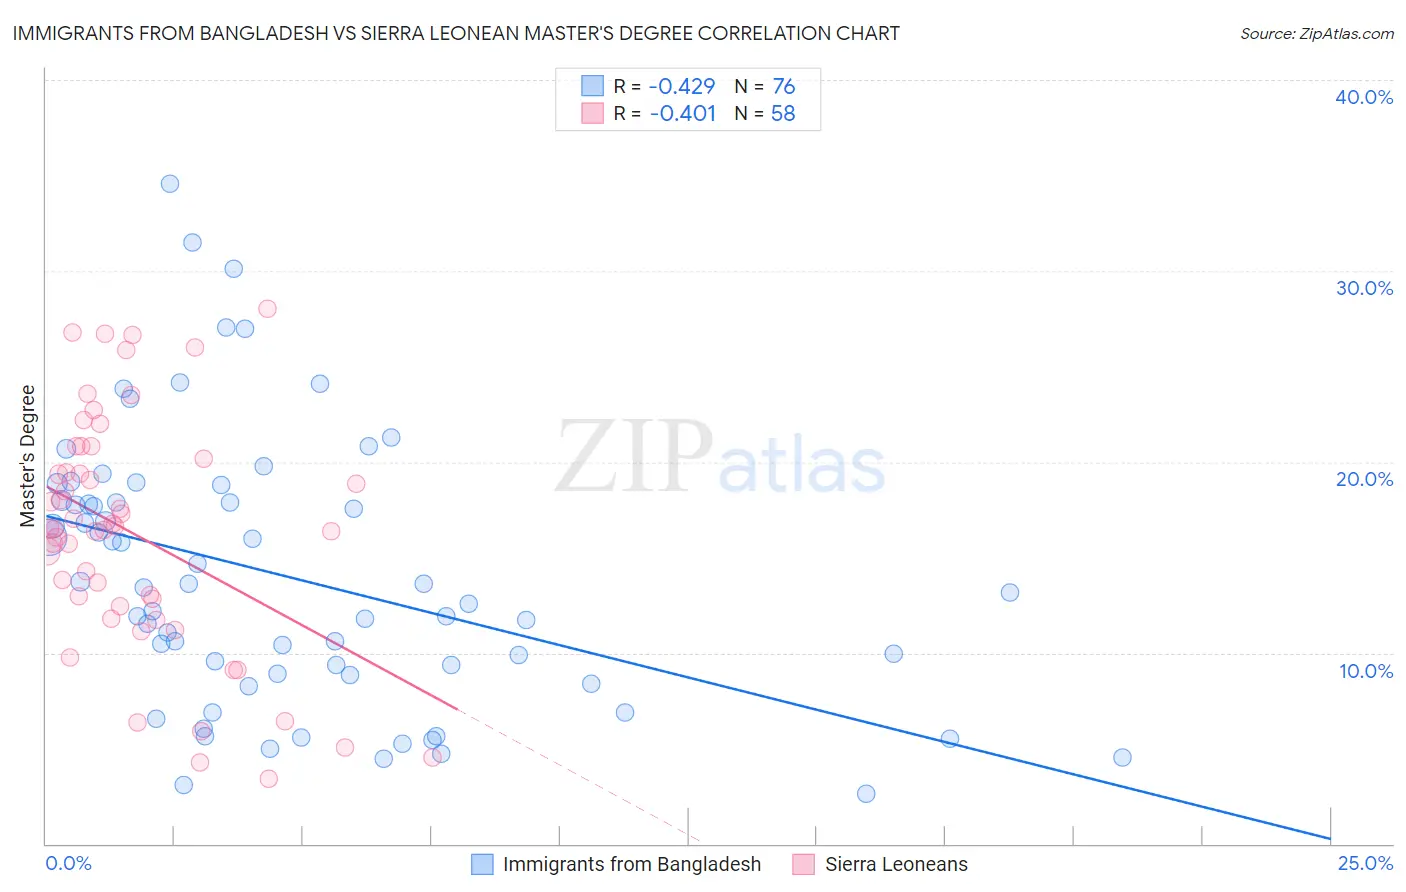
Immigrants from Bangladesh vs Sierra Leonean Master's Degree Correlation Chart
The statistical analysis conducted on geographies consisting of 203,660,853 people shows a moderate negative correlation between the proportion of Immigrants from Bangladesh and percentage of population with at least master's degree education in the United States with a correlation coefficient (R) of -0.429 and weighted average of 15.5%. Similarly, the statistical analysis conducted on geographies consisting of 83,347,079 people shows a moderate negative correlation between the proportion of Sierra Leoneans and percentage of population with at least master's degree education in the United States with a correlation coefficient (R) of -0.401 and weighted average of 16.8%, a difference of 8.5%.
Master's Degree Correlation Summary
| Measurement | Immigrants from Bangladesh | Sierra Leonean |
| Minimum | 2.6% | 3.4% |
| Maximum | 34.6% | 28.0% |
| Range | 31.9% | 24.6% |
| Mean | 14.0% | 16.2% |
| Median | 13.3% | 16.5% |
| Interquartile 25% (IQ1) | 8.9% | 12.5% |
| Interquartile 75% (IQ3) | 17.9% | 20.2% |
| Interquartile Range (IQR) | 9.1% | 7.7% |
| Standard Deviation (Sample) | 7.0% | 6.2% |
| Standard Deviation (Population) | 7.0% | 6.1% |
Similar Demographics by Master's Degree
Demographics Similar to Immigrants from Bangladesh by Master's Degree
In terms of master's degree, the demographic groups most similar to Immigrants from Bangladesh are Immigrants from South America (15.5%, a difference of 0.040%), Icelander (15.5%, a difference of 0.13%), Slavic (15.5%, a difference of 0.16%), Iraqi (15.5%, a difference of 0.21%), and Slovene (15.5%, a difference of 0.33%).
| Demographics | Rating | Rank | Master's Degree |
| Immigrants | Senegal | 78.2 /100 | #148 | Good 15.5% |
| Ghanaians | 78.2 /100 | #149 | Good 15.5% |
| Slovenes | 78.0 /100 | #150 | Good 15.5% |
| Iraqis | 77.3 /100 | #151 | Good 15.5% |
| Slavs | 77.0 /100 | #152 | Good 15.5% |
| Icelanders | 76.8 /100 | #153 | Good 15.5% |
| Immigrants | South America | 76.3 /100 | #154 | Good 15.5% |
| Immigrants | Bangladesh | 76.1 /100 | #155 | Good 15.5% |
| Bermudans | 73.9 /100 | #156 | Good 15.4% |
| Immigrants | Cameroon | 71.7 /100 | #157 | Good 15.4% |
| Immigrants | Poland | 71.5 /100 | #158 | Good 15.4% |
| Luxembourgers | 71.0 /100 | #159 | Good 15.3% |
| Kenyans | 70.3 /100 | #160 | Good 15.3% |
| Sudanese | 68.7 /100 | #161 | Good 15.3% |
| Peruvians | 68.7 /100 | #162 | Good 15.3% |
Demographics Similar to Sierra Leoneans by Master's Degree
In terms of master's degree, the demographic groups most similar to Sierra Leoneans are Moroccan (16.8%, a difference of 0.020%), Armenian (16.8%, a difference of 0.030%), Immigrants from Chile (16.8%, a difference of 0.050%), Immigrants from Albania (16.8%, a difference of 0.12%), and Austrian (16.7%, a difference of 0.32%).
| Demographics | Rating | Rank | Master's Degree |
| Immigrants | Nepal | 98.6 /100 | #101 | Exceptional 17.0% |
| Chileans | 98.6 /100 | #102 | Exceptional 16.9% |
| Alsatians | 98.4 /100 | #103 | Exceptional 16.9% |
| Ukrainians | 98.3 /100 | #104 | Exceptional 16.9% |
| Syrians | 98.3 /100 | #105 | Exceptional 16.8% |
| Immigrants | Albania | 98.1 /100 | #106 | Exceptional 16.8% |
| Armenians | 98.0 /100 | #107 | Exceptional 16.8% |
| Sierra Leoneans | 98.0 /100 | #108 | Exceptional 16.8% |
| Moroccans | 98.0 /100 | #109 | Exceptional 16.8% |
| Immigrants | Chile | 98.0 /100 | #110 | Exceptional 16.8% |
| Austrians | 97.8 /100 | #111 | Exceptional 16.7% |
| Macedonians | 97.7 /100 | #112 | Exceptional 16.7% |
| Arabs | 97.7 /100 | #113 | Exceptional 16.7% |
| Northern Europeans | 97.6 /100 | #114 | Exceptional 16.7% |
| Immigrants | Uganda | 97.3 /100 | #115 | Exceptional 16.6% |