Immigrants from Bahamas vs Potawatomi 8th Grade
COMPARE
Immigrants from Bahamas
Potawatomi
8th Grade
8th Grade Comparison
Immigrants from Bahamas
Potawatomi
95.5%
8TH GRADE
16.7/ 100
METRIC RATING
205th/ 347
METRIC RANK
96.4%
8TH GRADE
98.7/ 100
METRIC RATING
96th/ 347
METRIC RANK
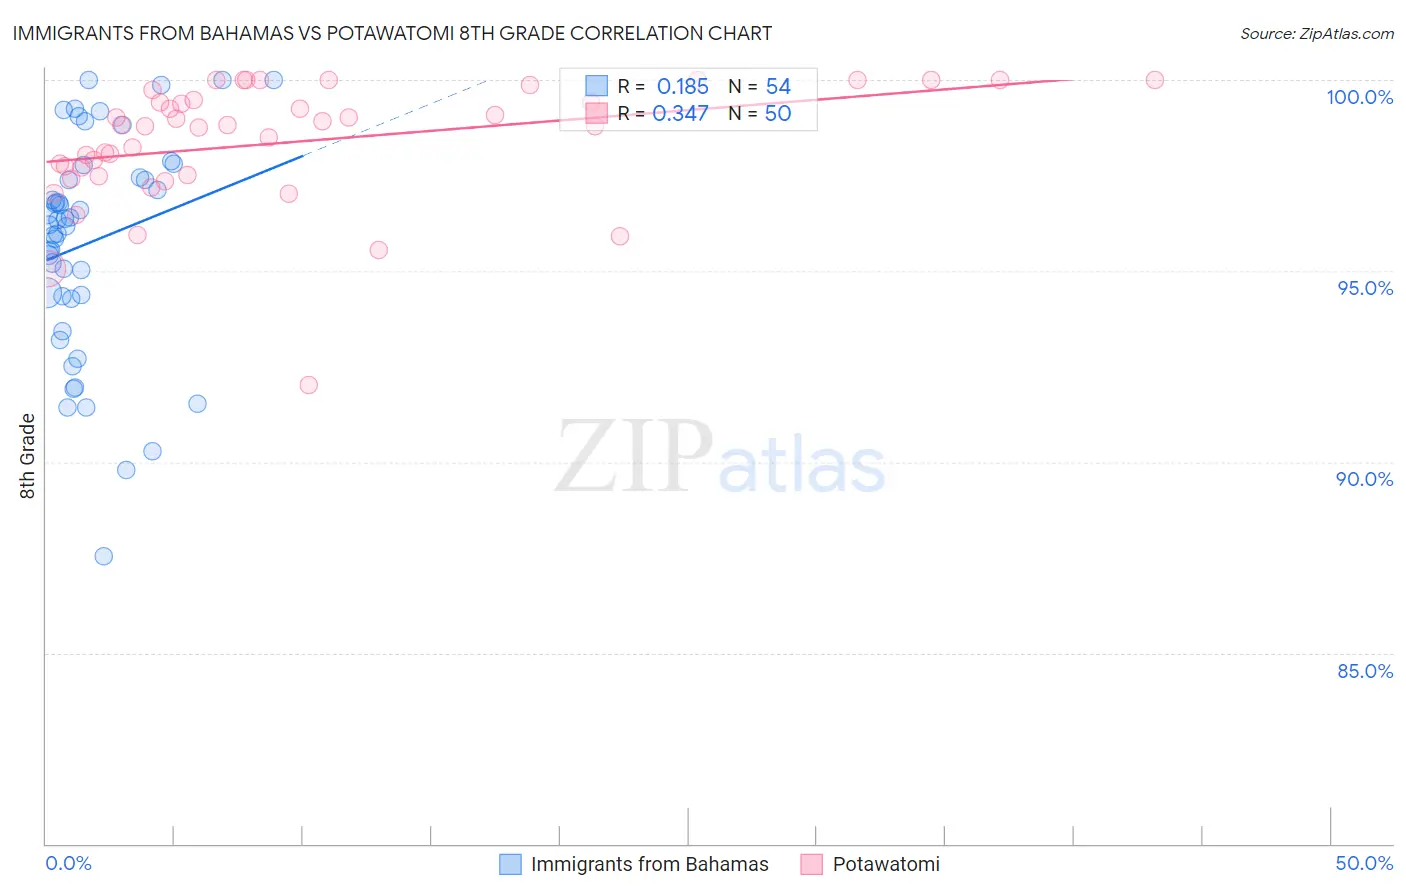
Immigrants from Bahamas vs Potawatomi 8th Grade Correlation Chart
The statistical analysis conducted on geographies consisting of 104,666,801 people shows a poor positive correlation between the proportion of Immigrants from Bahamas and percentage of population with at least 8th grade education in the United States with a correlation coefficient (R) of 0.185 and weighted average of 95.5%. Similarly, the statistical analysis conducted on geographies consisting of 117,769,196 people shows a mild positive correlation between the proportion of Potawatomi and percentage of population with at least 8th grade education in the United States with a correlation coefficient (R) of 0.347 and weighted average of 96.4%, a difference of 0.97%.
8th Grade Correlation Summary
| Measurement | Immigrants from Bahamas | Potawatomi |
| Minimum | 87.5% | 92.0% |
| Maximum | 100.0% | 100.0% |
| Range | 12.5% | 8.0% |
| Mean | 95.7% | 98.4% |
| Median | 96.3% | 98.8% |
| Interquartile 25% (IQ1) | 94.3% | 97.5% |
| Interquartile 75% (IQ3) | 97.4% | 99.5% |
| Interquartile Range (IQR) | 3.1% | 2.0% |
| Standard Deviation (Sample) | 2.8% | 1.6% |
| Standard Deviation (Population) | 2.8% | 1.6% |
Similar Demographics by 8th Grade
Demographics Similar to Immigrants from Bahamas by 8th Grade
In terms of 8th grade, the demographic groups most similar to Immigrants from Bahamas are Hawaiian (95.5%, a difference of 0.0%), Comanche (95.5%, a difference of 0.0%), Moroccan (95.5%, a difference of 0.010%), Immigrants from Sudan (95.5%, a difference of 0.020%), and Apache (95.5%, a difference of 0.030%).
| Demographics | Rating | Rank | 8th Grade |
| Paraguayans | 22.6 /100 | #198 | Fair 95.5% |
| Immigrants | Northern Africa | 22.5 /100 | #199 | Fair 95.5% |
| Argentineans | 22.2 /100 | #200 | Fair 95.5% |
| Immigrants | Argentina | 20.6 /100 | #201 | Fair 95.5% |
| Apache | 19.4 /100 | #202 | Poor 95.5% |
| Moroccans | 17.4 /100 | #203 | Poor 95.5% |
| Hawaiians | 16.7 /100 | #204 | Poor 95.5% |
| Immigrants | Bahamas | 16.7 /100 | #205 | Poor 95.5% |
| Comanche | 16.3 /100 | #206 | Poor 95.5% |
| Immigrants | Sudan | 15.1 /100 | #207 | Poor 95.5% |
| Portuguese | 14.3 /100 | #208 | Poor 95.5% |
| Immigrants | Lebanon | 13.7 /100 | #209 | Poor 95.4% |
| Africans | 13.6 /100 | #210 | Poor 95.4% |
| Immigrants | Morocco | 12.4 /100 | #211 | Poor 95.4% |
| Immigrants | Pakistan | 9.7 /100 | #212 | Tragic 95.4% |
Demographics Similar to Potawatomi by 8th Grade
In terms of 8th grade, the demographic groups most similar to Potawatomi are Osage (96.4%, a difference of 0.0%), Immigrants from Germany (96.4%, a difference of 0.0%), Immigrants from Singapore (96.4%, a difference of 0.010%), German Russian (96.4%, a difference of 0.010%), and Cree (96.4%, a difference of 0.010%).
| Demographics | Rating | Rank | 8th Grade |
| Chickasaw | 98.9 /100 | #89 | Exceptional 96.4% |
| Immigrants | Sweden | 98.9 /100 | #90 | Exceptional 96.4% |
| Thais | 98.9 /100 | #91 | Exceptional 96.4% |
| Menominee | 98.9 /100 | #92 | Exceptional 96.4% |
| Immigrants | Denmark | 98.8 /100 | #93 | Exceptional 96.4% |
| Immigrants | Singapore | 98.8 /100 | #94 | Exceptional 96.4% |
| German Russians | 98.8 /100 | #95 | Exceptional 96.4% |
| Potawatomi | 98.7 /100 | #96 | Exceptional 96.4% |
| Osage | 98.7 /100 | #97 | Exceptional 96.4% |
| Immigrants | Germany | 98.7 /100 | #98 | Exceptional 96.4% |
| Cree | 98.6 /100 | #99 | Exceptional 96.4% |
| Immigrants | Czechoslovakia | 98.6 /100 | #100 | Exceptional 96.4% |
| Bhutanese | 98.2 /100 | #101 | Exceptional 96.4% |
| South Africans | 98.2 /100 | #102 | Exceptional 96.4% |
| Immigrants | Saudi Arabia | 98.0 /100 | #103 | Exceptional 96.3% |