Immigrants from Bahamas vs Turkish 2nd Grade
COMPARE
Immigrants from Bahamas
Turkish
2nd Grade
2nd Grade Comparison
Immigrants from Bahamas
Turks
97.7%
2ND GRADE
8.4/ 100
METRIC RATING
212th/ 347
METRIC RANK
98.2%
2ND GRADE
97.6/ 100
METRIC RATING
104th/ 347
METRIC RANK
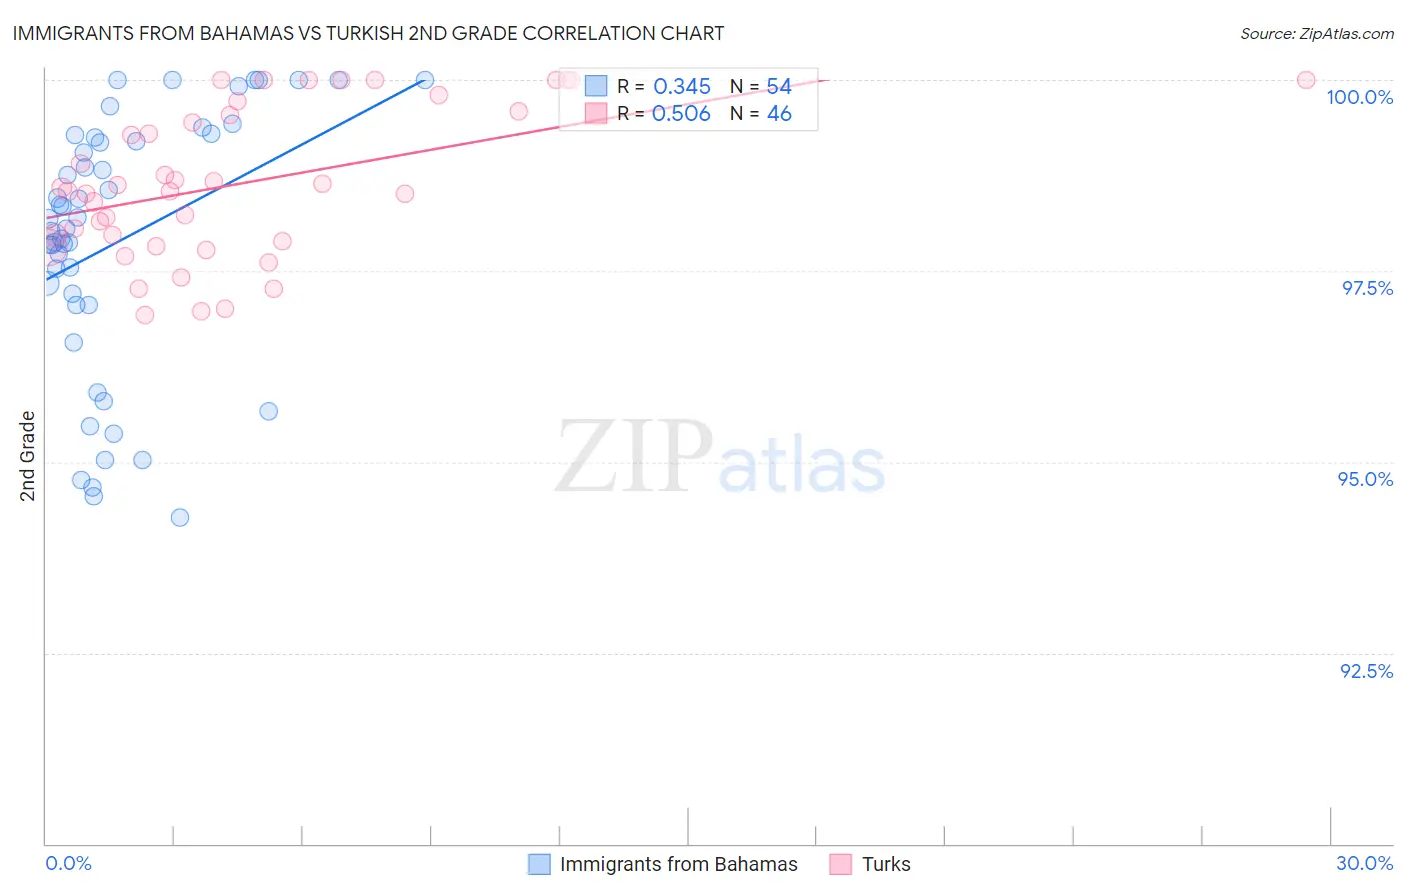
Immigrants from Bahamas vs Turkish 2nd Grade Correlation Chart
The statistical analysis conducted on geographies consisting of 104,666,627 people shows a mild positive correlation between the proportion of Immigrants from Bahamas and percentage of population with at least 2nd grade education in the United States with a correlation coefficient (R) of 0.345 and weighted average of 97.7%. Similarly, the statistical analysis conducted on geographies consisting of 271,858,657 people shows a substantial positive correlation between the proportion of Turks and percentage of population with at least 2nd grade education in the United States with a correlation coefficient (R) of 0.506 and weighted average of 98.2%, a difference of 0.48%.
2nd Grade Correlation Summary
| Measurement | Immigrants from Bahamas | Turkish |
| Minimum | 94.3% | 96.9% |
| Maximum | 100.0% | 100.0% |
| Range | 5.7% | 3.1% |
| Mean | 97.9% | 98.7% |
| Median | 98.1% | 98.6% |
| Interquartile 25% (IQ1) | 97.1% | 97.9% |
| Interquartile 75% (IQ3) | 99.2% | 99.6% |
| Interquartile Range (IQR) | 2.2% | 1.7% |
| Standard Deviation (Sample) | 1.7% | 0.97% |
| Standard Deviation (Population) | 1.7% | 0.96% |
Similar Demographics by 2nd Grade
Demographics Similar to Immigrants from Bahamas by 2nd Grade
In terms of 2nd grade, the demographic groups most similar to Immigrants from Bahamas are Moroccan (97.7%, a difference of 0.0%), Laotian (97.7%, a difference of 0.010%), Samoan (97.7%, a difference of 0.010%), Immigrants from Oceania (97.7%, a difference of 0.020%), and Costa Rican (97.7%, a difference of 0.020%).
| Demographics | Rating | Rank | 2nd Grade |
| Immigrants | Southern Europe | 18.1 /100 | #205 | Poor 97.8% |
| Immigrants | Chile | 17.3 /100 | #206 | Poor 97.7% |
| Africans | 15.6 /100 | #207 | Poor 97.7% |
| Immigrants | Northern Africa | 12.3 /100 | #208 | Poor 97.7% |
| Immigrants | Oceania | 10.9 /100 | #209 | Poor 97.7% |
| Costa Ricans | 10.5 /100 | #210 | Poor 97.7% |
| Laotians | 9.9 /100 | #211 | Tragic 97.7% |
| Immigrants | Bahamas | 8.4 /100 | #212 | Tragic 97.7% |
| Moroccans | 8.2 /100 | #213 | Tragic 97.7% |
| Samoans | 7.1 /100 | #214 | Tragic 97.7% |
| Bahamians | 6.8 /100 | #215 | Tragic 97.7% |
| South American Indians | 6.7 /100 | #216 | Tragic 97.7% |
| Uruguayans | 6.2 /100 | #217 | Tragic 97.7% |
| Sudanese | 5.7 /100 | #218 | Tragic 97.7% |
| Immigrants | Panama | 5.1 /100 | #219 | Tragic 97.6% |
Demographics Similar to Turks by 2nd Grade
In terms of 2nd grade, the demographic groups most similar to Turks are Pima (98.2%, a difference of 0.0%), Yugoslavian (98.2%, a difference of 0.0%), Bhutanese (98.1%, a difference of 0.0%), German Russian (98.1%, a difference of 0.0%), and Immigrants from Switzerland (98.1%, a difference of 0.010%).
| Demographics | Rating | Rank | 2nd Grade |
| Choctaw | 98.3 /100 | #97 | Exceptional 98.2% |
| Immigrants | Nonimmigrants | 98.3 /100 | #98 | Exceptional 98.2% |
| Immigrants | Ireland | 98.0 /100 | #99 | Exceptional 98.2% |
| Romanians | 98.0 /100 | #100 | Exceptional 98.2% |
| Puget Sound Salish | 98.0 /100 | #101 | Exceptional 98.2% |
| Cree | 98.0 /100 | #102 | Exceptional 98.2% |
| Pima | 97.6 /100 | #103 | Exceptional 98.2% |
| Turks | 97.6 /100 | #104 | Exceptional 98.2% |
| Yugoslavians | 97.5 /100 | #105 | Exceptional 98.2% |
| Bhutanese | 97.5 /100 | #106 | Exceptional 98.1% |
| German Russians | 97.4 /100 | #107 | Exceptional 98.1% |
| Immigrants | Switzerland | 97.3 /100 | #108 | Exceptional 98.1% |
| Basques | 97.2 /100 | #109 | Exceptional 98.1% |
| Immigrants | Singapore | 97.0 /100 | #110 | Exceptional 98.1% |
| Immigrants | Czechoslovakia | 96.9 /100 | #111 | Exceptional 98.1% |