Argentinean vs Immigrants from Eastern Asia 2nd Grade
COMPARE
Argentinean
Immigrants from Eastern Asia
2nd Grade
2nd Grade Comparison
Argentineans
Immigrants from Eastern Asia
97.9%
2ND GRADE
46.3/ 100
METRIC RATING
178th/ 347
METRIC RANK
97.6%
2ND GRADE
1.6/ 100
METRIC RATING
238th/ 347
METRIC RANK
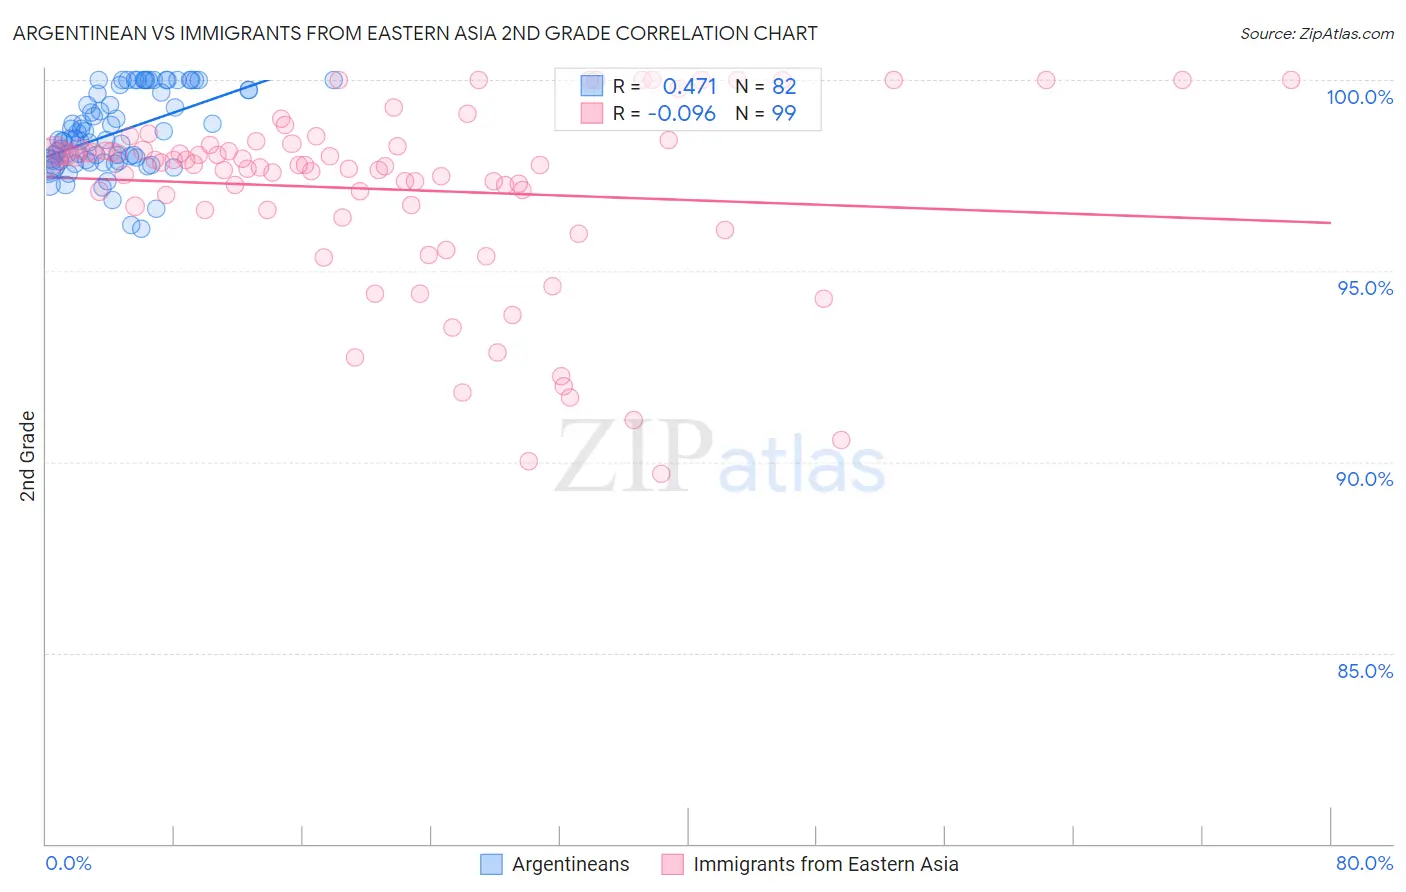
Argentinean vs Immigrants from Eastern Asia 2nd Grade Correlation Chart
The statistical analysis conducted on geographies consisting of 297,146,811 people shows a moderate positive correlation between the proportion of Argentineans and percentage of population with at least 2nd grade education in the United States with a correlation coefficient (R) of 0.471 and weighted average of 97.9%. Similarly, the statistical analysis conducted on geographies consisting of 499,865,893 people shows a slight negative correlation between the proportion of Immigrants from Eastern Asia and percentage of population with at least 2nd grade education in the United States with a correlation coefficient (R) of -0.096 and weighted average of 97.6%, a difference of 0.31%.
2nd Grade Correlation Summary
| Measurement | Argentinean | Immigrants from Eastern Asia |
| Minimum | 96.1% | 89.7% |
| Maximum | 100.0% | 100.0% |
| Range | 3.9% | 10.3% |
| Mean | 98.6% | 97.1% |
| Median | 98.4% | 97.8% |
| Interquartile 25% (IQ1) | 97.9% | 96.6% |
| Interquartile 75% (IQ3) | 99.7% | 98.3% |
| Interquartile Range (IQR) | 1.8% | 1.7% |
| Standard Deviation (Sample) | 1.0% | 2.4% |
| Standard Deviation (Population) | 1.0% | 2.4% |
Similar Demographics by 2nd Grade
Demographics Similar to Argentineans by 2nd Grade
In terms of 2nd grade, the demographic groups most similar to Argentineans are Immigrants from Brazil (97.9%, a difference of 0.0%), Immigrants from Venezuela (97.9%, a difference of 0.0%), Immigrants from Micronesia (97.9%, a difference of 0.010%), Immigrants from Bosnia and Herzegovina (97.9%, a difference of 0.010%), and Immigrants from Sri Lanka (97.9%, a difference of 0.010%).
| Demographics | Rating | Rank | 2nd Grade |
| Albanians | 52.8 /100 | #171 | Average 97.9% |
| Immigrants | Korea | 52.7 /100 | #172 | Average 97.9% |
| Kenyans | 52.7 /100 | #173 | Average 97.9% |
| Immigrants | Micronesia | 50.0 /100 | #174 | Average 97.9% |
| Immigrants | Bosnia and Herzegovina | 49.8 /100 | #175 | Average 97.9% |
| Immigrants | Sri Lanka | 48.7 /100 | #176 | Average 97.9% |
| Immigrants | Brazil | 46.6 /100 | #177 | Average 97.9% |
| Argentineans | 46.3 /100 | #178 | Average 97.9% |
| Immigrants | Venezuela | 46.1 /100 | #179 | Average 97.9% |
| Natives/Alaskans | 44.3 /100 | #180 | Average 97.9% |
| Egyptians | 44.3 /100 | #181 | Average 97.9% |
| Portuguese | 42.4 /100 | #182 | Average 97.8% |
| Immigrants | Poland | 42.2 /100 | #183 | Average 97.8% |
| Immigrants | Belarus | 41.5 /100 | #184 | Average 97.8% |
| Immigrants | Argentina | 40.6 /100 | #185 | Average 97.8% |
Demographics Similar to Immigrants from Eastern Asia by 2nd Grade
In terms of 2nd grade, the demographic groups most similar to Immigrants from Eastern Asia are Nigerian (97.6%, a difference of 0.0%), U.S. Virgin Islander (97.6%, a difference of 0.0%), Liberian (97.6%, a difference of 0.0%), Colombian (97.6%, a difference of 0.010%), and Korean (97.5%, a difference of 0.010%).
| Demographics | Rating | Rank | 2nd Grade |
| Immigrants | Pakistan | 2.3 /100 | #231 | Tragic 97.6% |
| Immigrants | Western Asia | 2.1 /100 | #232 | Tragic 97.6% |
| Immigrants | Uruguay | 2.1 /100 | #233 | Tragic 97.6% |
| Immigrants | Malaysia | 2.0 /100 | #234 | Tragic 97.6% |
| Colombians | 1.9 /100 | #235 | Tragic 97.6% |
| Nigerians | 1.7 /100 | #236 | Tragic 97.6% |
| U.S. Virgin Islanders | 1.6 /100 | #237 | Tragic 97.6% |
| Immigrants | Eastern Asia | 1.6 /100 | #238 | Tragic 97.6% |
| Liberians | 1.6 /100 | #239 | Tragic 97.6% |
| Koreans | 1.5 /100 | #240 | Tragic 97.5% |
| Ethiopians | 1.2 /100 | #241 | Tragic 97.5% |
| Immigrants | Indonesia | 1.2 /100 | #242 | Tragic 97.5% |
| Asians | 1.1 /100 | #243 | Tragic 97.5% |
| Immigrants | Iraq | 1.0 /100 | #244 | Tragic 97.5% |
| Immigrants | Eastern Africa | 0.9 /100 | #245 | Tragic 97.5% |