Immigrants from Austria vs Ukrainian High School Diploma
COMPARE
Immigrants from Austria
Ukrainian
High School Diploma
High School Diploma Comparison
Immigrants from Austria
Ukrainians
91.3%
HIGH SCHOOL DIPLOMA
99.8/ 100
METRIC RATING
44th/ 347
METRIC RANK
91.0%
HIGH SCHOOL DIPLOMA
99.6/ 100
METRIC RATING
64th/ 347
METRIC RANK
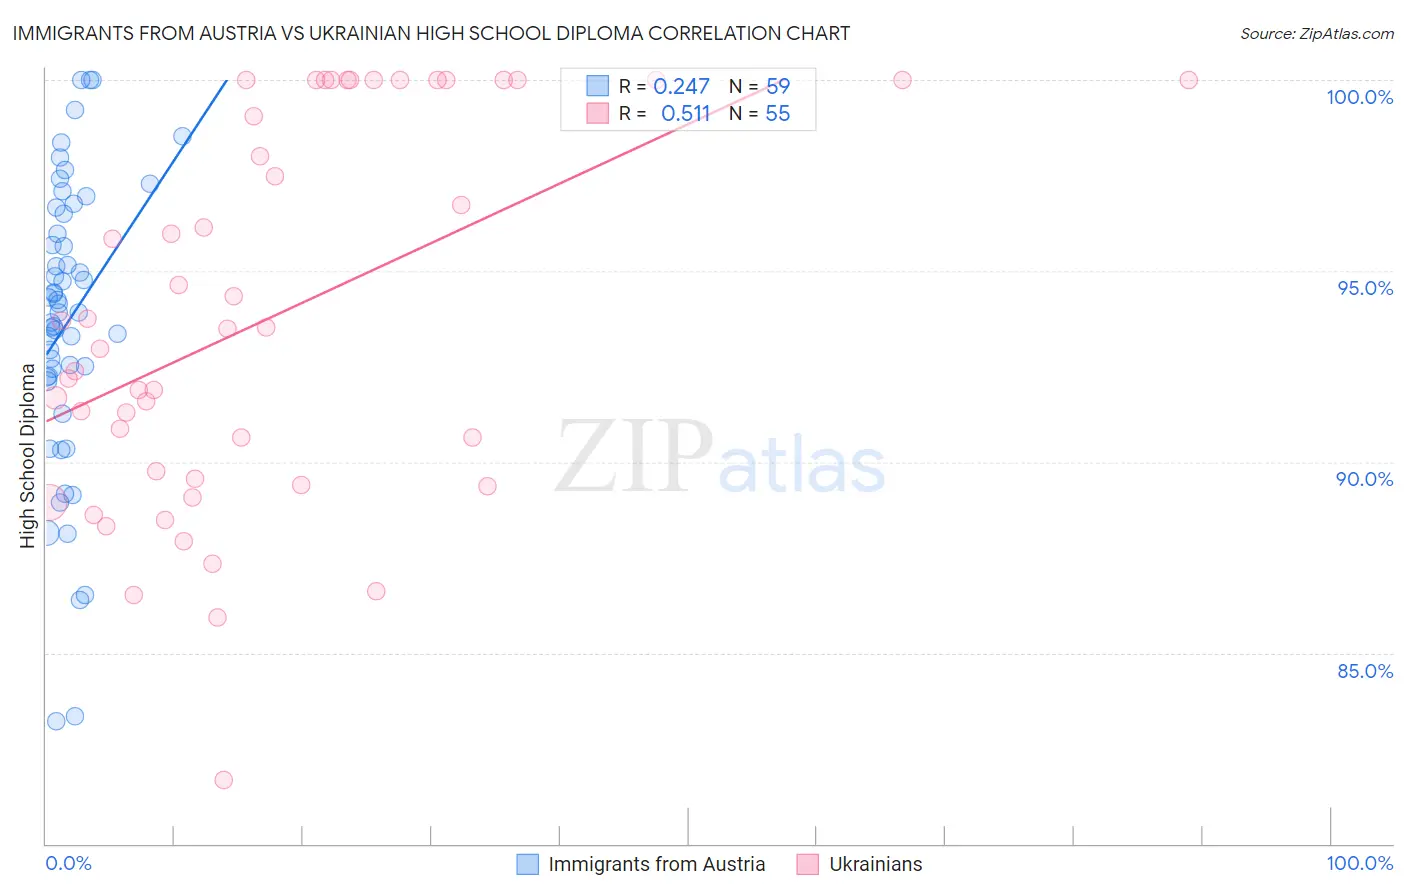
Immigrants from Austria vs Ukrainian High School Diploma Correlation Chart
The statistical analysis conducted on geographies consisting of 167,973,751 people shows a weak positive correlation between the proportion of Immigrants from Austria and percentage of population with at least high school diploma education in the United States with a correlation coefficient (R) of 0.247 and weighted average of 91.3%. Similarly, the statistical analysis conducted on geographies consisting of 448,696,775 people shows a substantial positive correlation between the proportion of Ukrainians and percentage of population with at least high school diploma education in the United States with a correlation coefficient (R) of 0.511 and weighted average of 91.0%, a difference of 0.32%.
High School Diploma Correlation Summary
| Measurement | Immigrants from Austria | Ukrainian |
| Minimum | 83.2% | 81.7% |
| Maximum | 100.0% | 100.0% |
| Range | 16.8% | 18.3% |
| Mean | 93.7% | 93.8% |
| Median | 93.9% | 93.5% |
| Interquartile 25% (IQ1) | 92.2% | 89.6% |
| Interquartile 75% (IQ3) | 96.5% | 100.0% |
| Interquartile Range (IQR) | 4.3% | 10.4% |
| Standard Deviation (Sample) | 3.8% | 4.9% |
| Standard Deviation (Population) | 3.7% | 4.9% |
Demographics Similar to Immigrants from Austria and Ukrainians by High School Diploma
In terms of high school diploma, the demographic groups most similar to Immigrants from Austria are Turkish (91.2%, a difference of 0.0%), Greek (91.2%, a difference of 0.040%), Australian (91.2%, a difference of 0.050%), Belgian (91.2%, a difference of 0.050%), and Bhutanese (91.2%, a difference of 0.060%). Similarly, the demographic groups most similar to Ukrainians are Immigrants from Netherlands (91.0%, a difference of 0.010%), Austrian (91.0%, a difference of 0.030%), Immigrants from Taiwan (91.0%, a difference of 0.060%), Immigrants from Japan (91.0%, a difference of 0.070%), and Slavic (91.0%, a difference of 0.10%).
| Demographics | Rating | Rank | High School Diploma |
| Immigrants | Austria | 99.8 /100 | #44 | Exceptional 91.3% |
| Turks | 99.8 /100 | #45 | Exceptional 91.2% |
| Greeks | 99.8 /100 | #46 | Exceptional 91.2% |
| Australians | 99.8 /100 | #47 | Exceptional 91.2% |
| Belgians | 99.8 /100 | #48 | Exceptional 91.2% |
| Bhutanese | 99.8 /100 | #49 | Exceptional 91.2% |
| Welsh | 99.8 /100 | #50 | Exceptional 91.2% |
| New Zealanders | 99.7 /100 | #51 | Exceptional 91.1% |
| Immigrants | Sweden | 99.7 /100 | #52 | Exceptional 91.1% |
| Immigrants | Belgium | 99.7 /100 | #53 | Exceptional 91.1% |
| Macedonians | 99.7 /100 | #54 | Exceptional 91.1% |
| Serbians | 99.7 /100 | #55 | Exceptional 91.1% |
| Immigrants | Canada | 99.7 /100 | #56 | Exceptional 91.1% |
| Zimbabweans | 99.7 /100 | #57 | Exceptional 91.1% |
| Slavs | 99.7 /100 | #58 | Exceptional 91.0% |
| Immigrants | North America | 99.7 /100 | #59 | Exceptional 91.0% |
| Immigrants | Japan | 99.6 /100 | #60 | Exceptional 91.0% |
| Immigrants | Taiwan | 99.6 /100 | #61 | Exceptional 91.0% |
| Austrians | 99.6 /100 | #62 | Exceptional 91.0% |
| Immigrants | Netherlands | 99.6 /100 | #63 | Exceptional 91.0% |
| Ukrainians | 99.6 /100 | #64 | Exceptional 91.0% |