Immigrants from Austria vs British 8th Grade
COMPARE
Immigrants from Austria
British
8th Grade
8th Grade Comparison
Immigrants from Austria
British
96.7%
8TH GRADE
99.8/ 100
METRIC RATING
61st/ 347
METRIC RANK
97.0%
8TH GRADE
100.0/ 100
METRIC RATING
38th/ 347
METRIC RANK
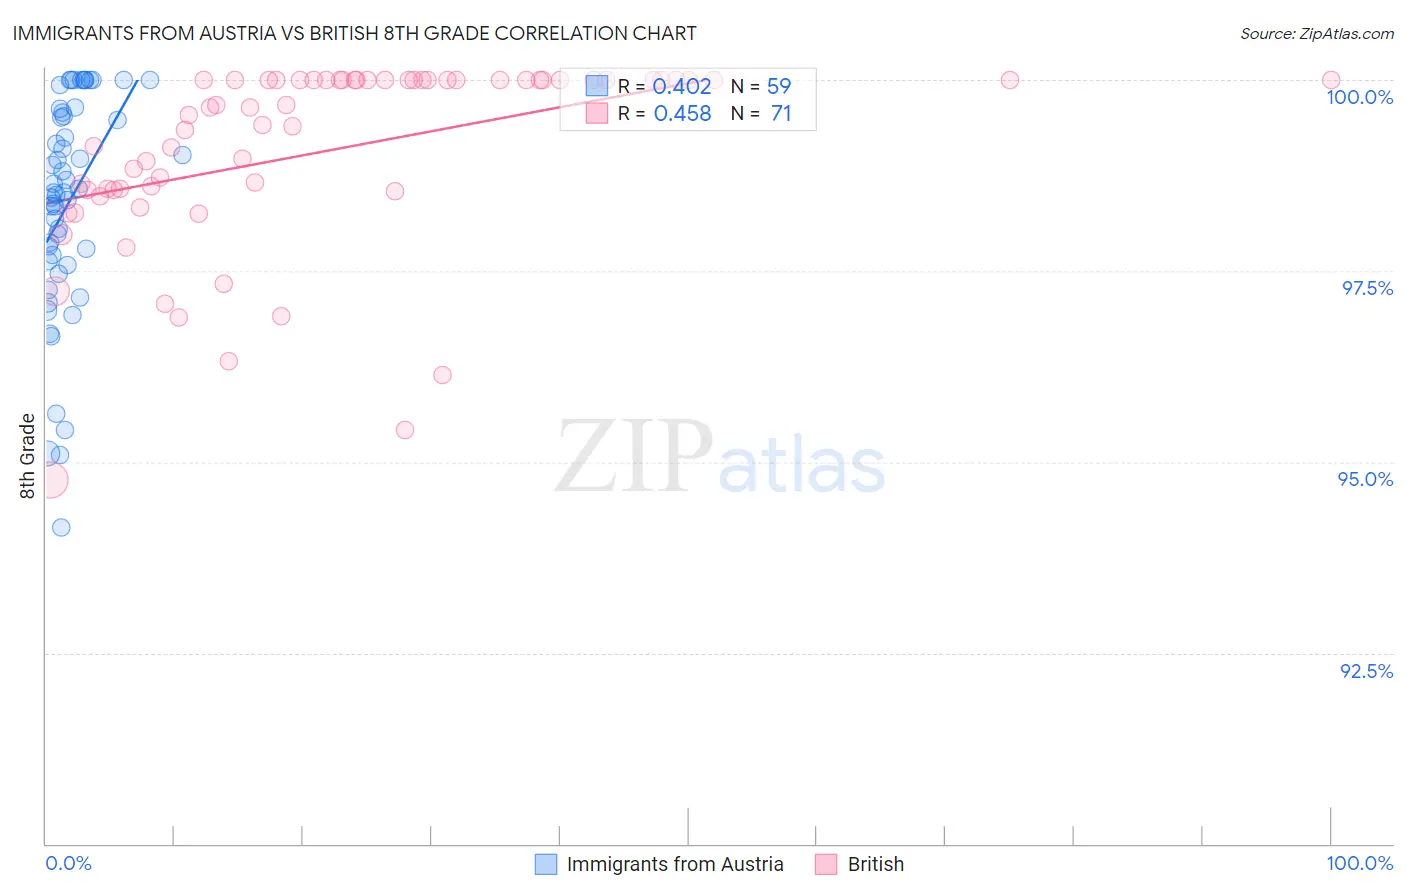
Immigrants from Austria vs British 8th Grade Correlation Chart
The statistical analysis conducted on geographies consisting of 167,973,800 people shows a moderate positive correlation between the proportion of Immigrants from Austria and percentage of population with at least 8th grade education in the United States with a correlation coefficient (R) of 0.402 and weighted average of 96.7%. Similarly, the statistical analysis conducted on geographies consisting of 531,463,582 people shows a moderate positive correlation between the proportion of British and percentage of population with at least 8th grade education in the United States with a correlation coefficient (R) of 0.458 and weighted average of 97.0%, a difference of 0.31%.
8th Grade Correlation Summary
| Measurement | Immigrants from Austria | British |
| Minimum | 94.1% | 94.8% |
| Maximum | 100.0% | 100.0% |
| Range | 5.9% | 5.2% |
| Mean | 98.4% | 99.1% |
| Median | 98.5% | 99.6% |
| Interquartile 25% (IQ1) | 97.6% | 98.6% |
| Interquartile 75% (IQ3) | 99.6% | 100.0% |
| Interquartile Range (IQR) | 1.9% | 1.4% |
| Standard Deviation (Sample) | 1.4% | 1.2% |
| Standard Deviation (Population) | 1.4% | 1.2% |
Similar Demographics by 8th Grade
Demographics Similar to Immigrants from Austria by 8th Grade
In terms of 8th grade, the demographic groups most similar to Immigrants from Austria are Immigrants from Northern Europe (96.7%, a difference of 0.0%), Immigrants from North America (96.7%, a difference of 0.010%), White/Caucasian (96.7%, a difference of 0.010%), Immigrants from Canada (96.7%, a difference of 0.020%), and Ukrainian (96.7%, a difference of 0.030%).
| Demographics | Rating | Rank | 8th Grade |
| Serbians | 99.8 /100 | #54 | Exceptional 96.7% |
| Russians | 99.8 /100 | #55 | Exceptional 96.7% |
| Australians | 99.8 /100 | #56 | Exceptional 96.7% |
| Macedonians | 99.8 /100 | #57 | Exceptional 96.7% |
| Immigrants | Canada | 99.8 /100 | #58 | Exceptional 96.7% |
| Immigrants | North America | 99.8 /100 | #59 | Exceptional 96.7% |
| Immigrants | Northern Europe | 99.8 /100 | #60 | Exceptional 96.7% |
| Immigrants | Austria | 99.8 /100 | #61 | Exceptional 96.7% |
| Whites/Caucasians | 99.8 /100 | #62 | Exceptional 96.7% |
| Ukrainians | 99.7 /100 | #63 | Exceptional 96.7% |
| Immigrants | India | 99.7 /100 | #64 | Exceptional 96.6% |
| Native Hawaiians | 99.7 /100 | #65 | Exceptional 96.6% |
| Canadians | 99.7 /100 | #66 | Exceptional 96.6% |
| Iranians | 99.7 /100 | #67 | Exceptional 96.6% |
| Creek | 99.7 /100 | #68 | Exceptional 96.6% |
Demographics Similar to British by 8th Grade
In terms of 8th grade, the demographic groups most similar to British are Hungarian (97.0%, a difference of 0.0%), Belgian (97.0%, a difference of 0.020%), Latvian (97.0%, a difference of 0.020%), Inupiat (97.0%, a difference of 0.020%), and Eastern European (97.0%, a difference of 0.020%).
| Demographics | Rating | Rank | 8th Grade |
| Chippewa | 100.0 /100 | #31 | Exceptional 97.1% |
| Yup'ik | 100.0 /100 | #32 | Exceptional 97.0% |
| Swiss | 100.0 /100 | #33 | Exceptional 97.0% |
| Luxembourgers | 100.0 /100 | #34 | Exceptional 97.0% |
| Alaska Natives | 100.0 /100 | #35 | Exceptional 97.0% |
| Belgians | 100.0 /100 | #36 | Exceptional 97.0% |
| Latvians | 100.0 /100 | #37 | Exceptional 97.0% |
| British | 100.0 /100 | #38 | Exceptional 97.0% |
| Hungarians | 100.0 /100 | #39 | Exceptional 97.0% |
| Inupiat | 100.0 /100 | #40 | Exceptional 97.0% |
| Eastern Europeans | 100.0 /100 | #41 | Exceptional 97.0% |
| Chinese | 100.0 /100 | #42 | Exceptional 96.9% |
| Aleuts | 99.9 /100 | #43 | Exceptional 96.9% |
| Maltese | 99.9 /100 | #44 | Exceptional 96.9% |
| Northern Europeans | 99.9 /100 | #45 | Exceptional 96.9% |