Immigrants from Australia vs Immigrants from Pakistan 11th Grade
COMPARE
Immigrants from Australia
Immigrants from Pakistan
11th Grade
11th Grade Comparison
Immigrants from Australia
Immigrants from Pakistan
94.0%
11TH GRADE
99.9/ 100
METRIC RATING
53rd/ 347
METRIC RANK
92.5%
11TH GRADE
52.3/ 100
METRIC RATING
172nd/ 347
METRIC RANK
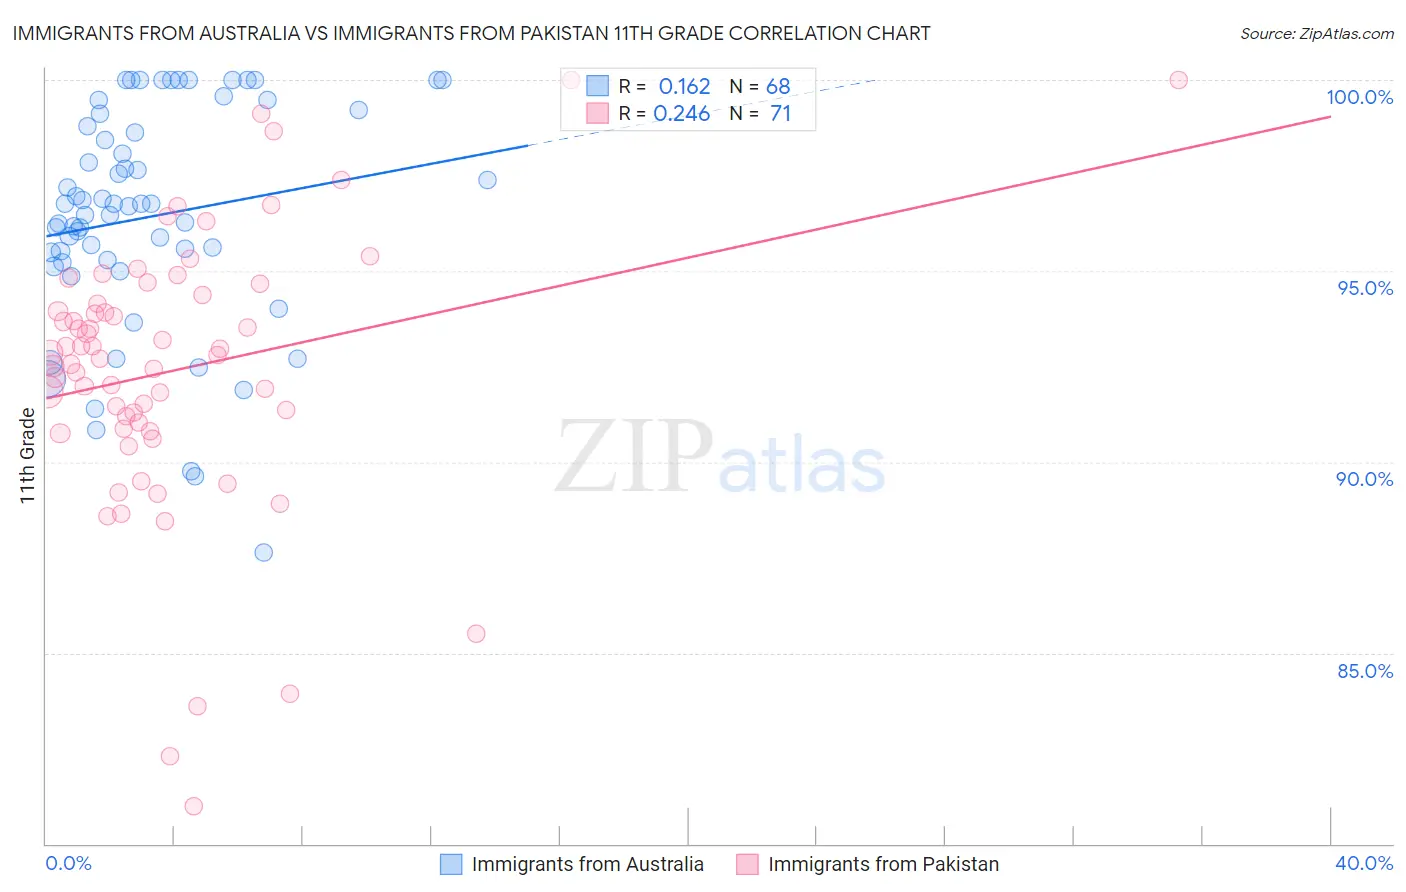
Immigrants from Australia vs Immigrants from Pakistan 11th Grade Correlation Chart
The statistical analysis conducted on geographies consisting of 227,202,828 people shows a poor positive correlation between the proportion of Immigrants from Australia and percentage of population with at least 11th grade education in the United States with a correlation coefficient (R) of 0.162 and weighted average of 94.0%. Similarly, the statistical analysis conducted on geographies consisting of 283,836,095 people shows a weak positive correlation between the proportion of Immigrants from Pakistan and percentage of population with at least 11th grade education in the United States with a correlation coefficient (R) of 0.246 and weighted average of 92.5%, a difference of 1.6%.
11th Grade Correlation Summary
| Measurement | Immigrants from Australia | Immigrants from Pakistan |
| Minimum | 87.6% | 81.0% |
| Maximum | 100.0% | 100.0% |
| Range | 12.4% | 19.0% |
| Mean | 96.4% | 92.4% |
| Median | 96.7% | 92.8% |
| Interquartile 25% (IQ1) | 95.3% | 90.9% |
| Interquartile 75% (IQ3) | 98.9% | 94.4% |
| Interquartile Range (IQR) | 3.7% | 3.5% |
| Standard Deviation (Sample) | 2.9% | 3.6% |
| Standard Deviation (Population) | 2.9% | 3.6% |
Similar Demographics by 11th Grade
Demographics Similar to Immigrants from Australia by 11th Grade
In terms of 11th grade, the demographic groups most similar to Immigrants from Australia are Immigrants from Canada (94.0%, a difference of 0.010%), Immigrants from North America (94.0%, a difference of 0.010%), Czechoslovakian (94.0%, a difference of 0.010%), Turkish (94.0%, a difference of 0.020%), and French Canadian (94.0%, a difference of 0.020%).
| Demographics | Rating | Rank | 11th Grade |
| Serbians | 99.9 /100 | #46 | Exceptional 94.1% |
| Filipinos | 99.9 /100 | #47 | Exceptional 94.1% |
| Macedonians | 99.9 /100 | #48 | Exceptional 94.1% |
| Slavs | 99.9 /100 | #49 | Exceptional 94.1% |
| French | 99.9 /100 | #50 | Exceptional 94.1% |
| Turks | 99.9 /100 | #51 | Exceptional 94.0% |
| Immigrants | Canada | 99.9 /100 | #52 | Exceptional 94.0% |
| Immigrants | Australia | 99.9 /100 | #53 | Exceptional 94.0% |
| Immigrants | North America | 99.9 /100 | #54 | Exceptional 94.0% |
| Czechoslovakians | 99.9 /100 | #55 | Exceptional 94.0% |
| French Canadians | 99.9 /100 | #56 | Exceptional 94.0% |
| New Zealanders | 99.9 /100 | #57 | Exceptional 94.0% |
| Iranians | 99.9 /100 | #58 | Exceptional 94.0% |
| Bhutanese | 99.8 /100 | #59 | Exceptional 94.0% |
| Okinawans | 99.8 /100 | #60 | Exceptional 94.0% |
Demographics Similar to Immigrants from Pakistan by 11th Grade
In terms of 11th grade, the demographic groups most similar to Immigrants from Pakistan are Indian (Asian) (92.5%, a difference of 0.010%), Laotian (92.6%, a difference of 0.020%), Asian (92.5%, a difference of 0.020%), Shoshone (92.5%, a difference of 0.030%), and Immigrants from Albania (92.6%, a difference of 0.050%).
| Demographics | Rating | Rank | 11th Grade |
| Immigrants | Iraq | 63.7 /100 | #165 | Good 92.6% |
| Bermudans | 62.3 /100 | #166 | Good 92.6% |
| Alsatians | 60.2 /100 | #167 | Good 92.6% |
| Sierra Leoneans | 58.7 /100 | #168 | Average 92.6% |
| Immigrants | Albania | 57.8 /100 | #169 | Average 92.6% |
| Immigrants | Northern Africa | 57.3 /100 | #170 | Average 92.6% |
| Laotians | 54.4 /100 | #171 | Average 92.6% |
| Immigrants | Pakistan | 52.3 /100 | #172 | Average 92.5% |
| Indians (Asian) | 51.5 /100 | #173 | Average 92.5% |
| Asians | 50.0 /100 | #174 | Average 92.5% |
| Shoshone | 48.9 /100 | #175 | Average 92.5% |
| Spaniards | 46.9 /100 | #176 | Average 92.5% |
| Guamanians/Chamorros | 45.0 /100 | #177 | Average 92.5% |
| Sudanese | 43.4 /100 | #178 | Average 92.5% |
| Creek | 40.9 /100 | #179 | Average 92.4% |