Immigrants from Australia vs Iroquois 11th Grade
COMPARE
Immigrants from Australia
Iroquois
11th Grade
11th Grade Comparison
Immigrants from Australia
Iroquois
94.0%
11TH GRADE
99.9/ 100
METRIC RATING
53rd/ 347
METRIC RANK
92.8%
11TH GRADE
79.1/ 100
METRIC RATING
146th/ 347
METRIC RANK
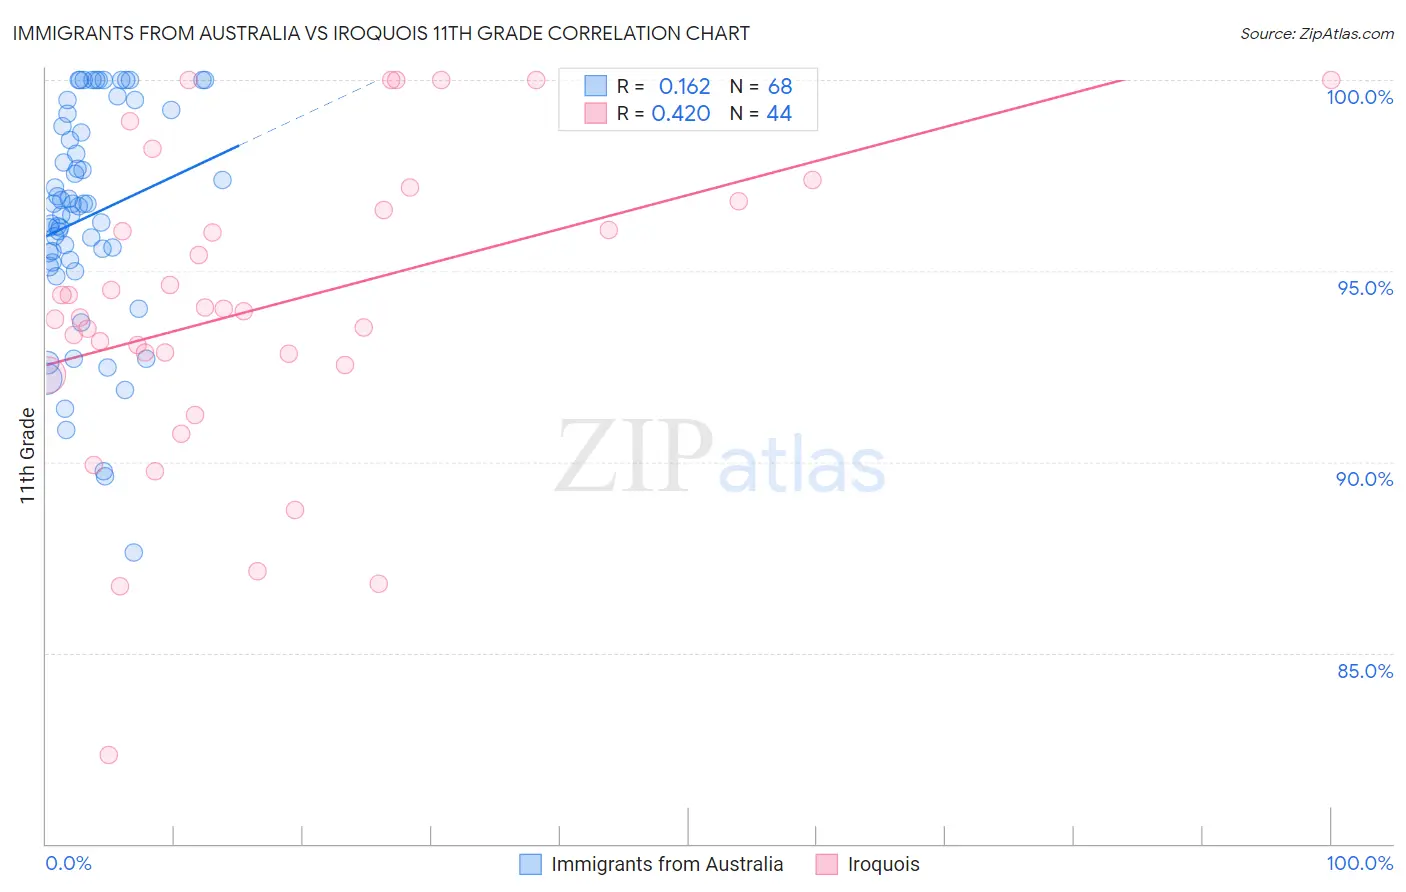
Immigrants from Australia vs Iroquois 11th Grade Correlation Chart
The statistical analysis conducted on geographies consisting of 227,202,828 people shows a poor positive correlation between the proportion of Immigrants from Australia and percentage of population with at least 11th grade education in the United States with a correlation coefficient (R) of 0.162 and weighted average of 94.0%. Similarly, the statistical analysis conducted on geographies consisting of 207,308,653 people shows a moderate positive correlation between the proportion of Iroquois and percentage of population with at least 11th grade education in the United States with a correlation coefficient (R) of 0.420 and weighted average of 92.8%, a difference of 1.3%.
11th Grade Correlation Summary
| Measurement | Immigrants from Australia | Iroquois |
| Minimum | 87.6% | 82.3% |
| Maximum | 100.0% | 100.0% |
| Range | 12.4% | 17.7% |
| Mean | 96.4% | 94.1% |
| Median | 96.7% | 94.0% |
| Interquartile 25% (IQ1) | 95.3% | 92.7% |
| Interquartile 75% (IQ3) | 98.9% | 96.7% |
| Interquartile Range (IQR) | 3.7% | 4.0% |
| Standard Deviation (Sample) | 2.9% | 4.0% |
| Standard Deviation (Population) | 2.9% | 4.0% |
Similar Demographics by 11th Grade
Demographics Similar to Immigrants from Australia by 11th Grade
In terms of 11th grade, the demographic groups most similar to Immigrants from Australia are Immigrants from Canada (94.0%, a difference of 0.010%), Immigrants from North America (94.0%, a difference of 0.010%), Czechoslovakian (94.0%, a difference of 0.010%), Turkish (94.0%, a difference of 0.020%), and French Canadian (94.0%, a difference of 0.020%).
| Demographics | Rating | Rank | 11th Grade |
| Serbians | 99.9 /100 | #46 | Exceptional 94.1% |
| Filipinos | 99.9 /100 | #47 | Exceptional 94.1% |
| Macedonians | 99.9 /100 | #48 | Exceptional 94.1% |
| Slavs | 99.9 /100 | #49 | Exceptional 94.1% |
| French | 99.9 /100 | #50 | Exceptional 94.1% |
| Turks | 99.9 /100 | #51 | Exceptional 94.0% |
| Immigrants | Canada | 99.9 /100 | #52 | Exceptional 94.0% |
| Immigrants | Australia | 99.9 /100 | #53 | Exceptional 94.0% |
| Immigrants | North America | 99.9 /100 | #54 | Exceptional 94.0% |
| Czechoslovakians | 99.9 /100 | #55 | Exceptional 94.0% |
| French Canadians | 99.9 /100 | #56 | Exceptional 94.0% |
| New Zealanders | 99.9 /100 | #57 | Exceptional 94.0% |
| Iranians | 99.9 /100 | #58 | Exceptional 94.0% |
| Bhutanese | 99.8 /100 | #59 | Exceptional 94.0% |
| Okinawans | 99.8 /100 | #60 | Exceptional 94.0% |
Demographics Similar to Iroquois by 11th Grade
In terms of 11th grade, the demographic groups most similar to Iroquois are Pakistani (92.8%, a difference of 0.010%), Immigrants from Kenya (92.8%, a difference of 0.010%), Hmong (92.8%, a difference of 0.010%), Immigrants from Poland (92.8%, a difference of 0.010%), and Assyrian/Chaldean/Syriac (92.8%, a difference of 0.020%).
| Demographics | Rating | Rank | 11th Grade |
| Crow | 84.1 /100 | #139 | Excellent 92.9% |
| Venezuelans | 83.4 /100 | #140 | Excellent 92.9% |
| Chileans | 83.0 /100 | #141 | Excellent 92.9% |
| Kenyans | 82.0 /100 | #142 | Excellent 92.9% |
| Ugandans | 81.4 /100 | #143 | Excellent 92.9% |
| Assyrians/Chaldeans/Syriacs | 80.5 /100 | #144 | Excellent 92.8% |
| Pakistanis | 79.6 /100 | #145 | Good 92.8% |
| Iroquois | 79.1 /100 | #146 | Good 92.8% |
| Immigrants | Kenya | 78.7 /100 | #147 | Good 92.8% |
| Hmong | 78.6 /100 | #148 | Good 92.8% |
| Immigrants | Poland | 78.5 /100 | #149 | Good 92.8% |
| Immigrants | Egypt | 77.5 /100 | #150 | Good 92.8% |
| Potawatomi | 74.3 /100 | #151 | Good 92.8% |
| Iraqis | 74.2 /100 | #152 | Good 92.8% |
| Brazilians | 73.9 /100 | #153 | Good 92.8% |