Immigrants from Australia vs Taiwanese 11th Grade
COMPARE
Immigrants from Australia
Taiwanese
11th Grade
11th Grade Comparison
Immigrants from Australia
Taiwanese
94.0%
11TH GRADE
99.9/ 100
METRIC RATING
53rd/ 347
METRIC RANK
91.3%
11TH GRADE
0.6/ 100
METRIC RATING
261st/ 347
METRIC RANK
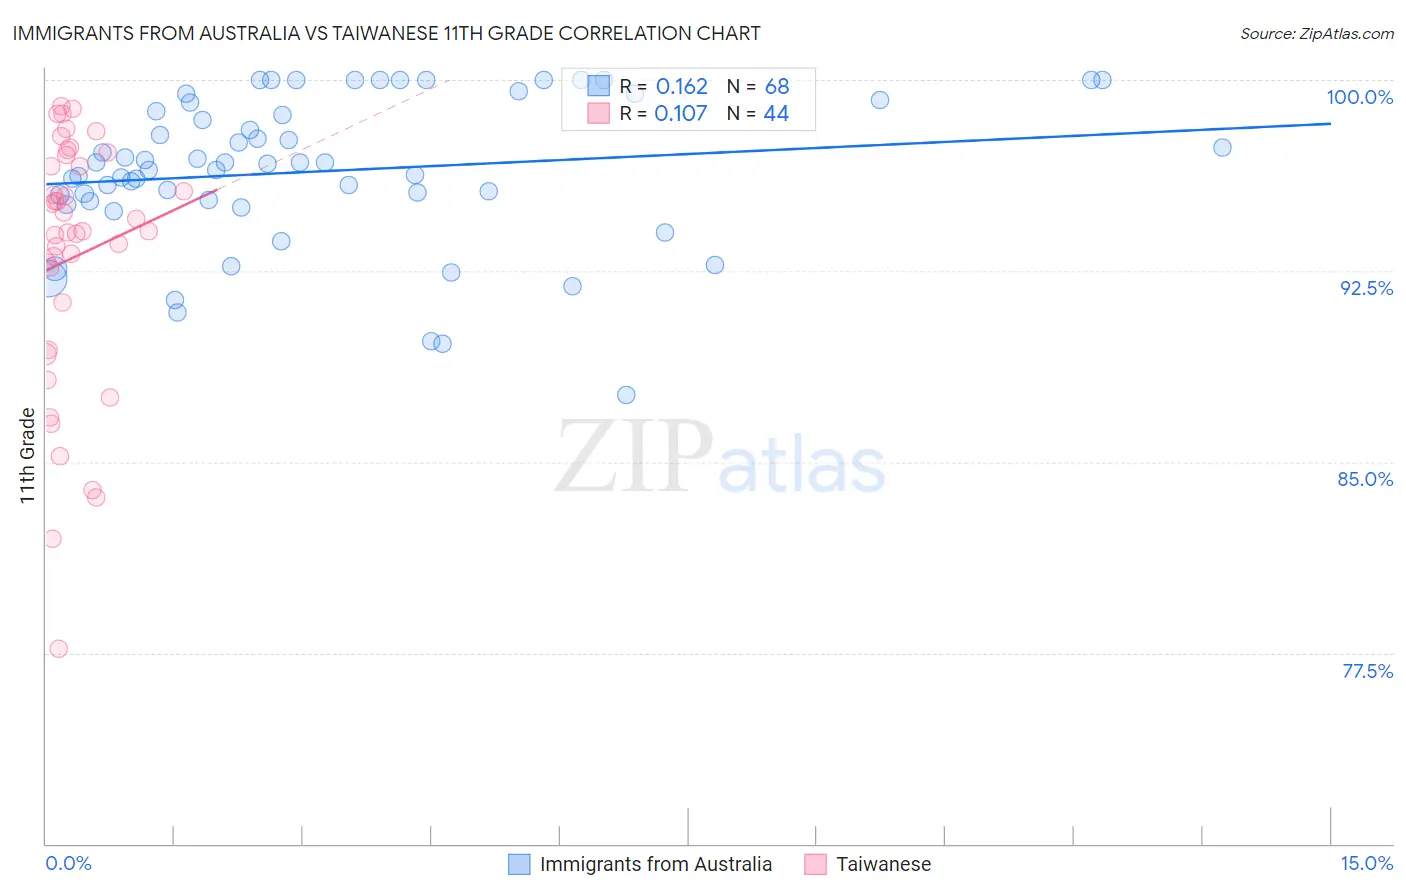
Immigrants from Australia vs Taiwanese 11th Grade Correlation Chart
The statistical analysis conducted on geographies consisting of 227,202,828 people shows a poor positive correlation between the proportion of Immigrants from Australia and percentage of population with at least 11th grade education in the United States with a correlation coefficient (R) of 0.162 and weighted average of 94.0%. Similarly, the statistical analysis conducted on geographies consisting of 31,724,936 people shows a poor positive correlation between the proportion of Taiwanese and percentage of population with at least 11th grade education in the United States with a correlation coefficient (R) of 0.107 and weighted average of 91.3%, a difference of 2.9%.
11th Grade Correlation Summary
| Measurement | Immigrants from Australia | Taiwanese |
| Minimum | 87.6% | 77.7% |
| Maximum | 100.0% | 98.9% |
| Range | 12.4% | 21.3% |
| Mean | 96.4% | 93.0% |
| Median | 96.7% | 94.0% |
| Interquartile 25% (IQ1) | 95.3% | 90.3% |
| Interquartile 75% (IQ3) | 98.9% | 96.8% |
| Interquartile Range (IQR) | 3.7% | 6.5% |
| Standard Deviation (Sample) | 2.9% | 5.1% |
| Standard Deviation (Population) | 2.9% | 5.0% |
Similar Demographics by 11th Grade
Demographics Similar to Immigrants from Australia by 11th Grade
In terms of 11th grade, the demographic groups most similar to Immigrants from Australia are Immigrants from Canada (94.0%, a difference of 0.010%), Immigrants from North America (94.0%, a difference of 0.010%), Czechoslovakian (94.0%, a difference of 0.010%), Turkish (94.0%, a difference of 0.020%), and French Canadian (94.0%, a difference of 0.020%).
| Demographics | Rating | Rank | 11th Grade |
| Serbians | 99.9 /100 | #46 | Exceptional 94.1% |
| Filipinos | 99.9 /100 | #47 | Exceptional 94.1% |
| Macedonians | 99.9 /100 | #48 | Exceptional 94.1% |
| Slavs | 99.9 /100 | #49 | Exceptional 94.1% |
| French | 99.9 /100 | #50 | Exceptional 94.1% |
| Turks | 99.9 /100 | #51 | Exceptional 94.0% |
| Immigrants | Canada | 99.9 /100 | #52 | Exceptional 94.0% |
| Immigrants | Australia | 99.9 /100 | #53 | Exceptional 94.0% |
| Immigrants | North America | 99.9 /100 | #54 | Exceptional 94.0% |
| Czechoslovakians | 99.9 /100 | #55 | Exceptional 94.0% |
| French Canadians | 99.9 /100 | #56 | Exceptional 94.0% |
| New Zealanders | 99.9 /100 | #57 | Exceptional 94.0% |
| Iranians | 99.9 /100 | #58 | Exceptional 94.0% |
| Bhutanese | 99.8 /100 | #59 | Exceptional 94.0% |
| Okinawans | 99.8 /100 | #60 | Exceptional 94.0% |
Demographics Similar to Taiwanese by 11th Grade
In terms of 11th grade, the demographic groups most similar to Taiwanese are Jamaican (91.4%, a difference of 0.010%), Spanish American (91.4%, a difference of 0.010%), Immigrants from Uruguay (91.3%, a difference of 0.010%), Immigrants from Colombia (91.4%, a difference of 0.030%), and Immigrants from Senegal (91.4%, a difference of 0.050%).
| Demographics | Rating | Rank | 11th Grade |
| Immigrants | Eritrea | 0.7 /100 | #254 | Tragic 91.4% |
| Blacks/African Americans | 0.7 /100 | #255 | Tragic 91.4% |
| Immigrants | Senegal | 0.7 /100 | #256 | Tragic 91.4% |
| Cajuns | 0.7 /100 | #257 | Tragic 91.4% |
| Immigrants | Colombia | 0.6 /100 | #258 | Tragic 91.4% |
| Jamaicans | 0.6 /100 | #259 | Tragic 91.4% |
| Spanish Americans | 0.6 /100 | #260 | Tragic 91.4% |
| Taiwanese | 0.6 /100 | #261 | Tragic 91.3% |
| Immigrants | Uruguay | 0.5 /100 | #262 | Tragic 91.3% |
| Immigrants | Ghana | 0.3 /100 | #263 | Tragic 91.2% |
| Yup'ik | 0.3 /100 | #264 | Tragic 91.2% |
| Pueblo | 0.3 /100 | #265 | Tragic 91.2% |
| Immigrants | Western Africa | 0.3 /100 | #266 | Tragic 91.2% |
| Immigrants | Jamaica | 0.3 /100 | #267 | Tragic 91.2% |
| U.S. Virgin Islanders | 0.2 /100 | #268 | Tragic 91.1% |