Immigrants from Australia vs Crow 3rd Grade
COMPARE
Immigrants from Australia
Crow
3rd Grade
3rd Grade Comparison
Immigrants from Australia
Crow
98.1%
3RD GRADE
98.9/ 100
METRIC RATING
85th/ 347
METRIC RANK
99.6%
3RD GRADE
100.0/ 100
METRIC RATING
1st/ 347
METRIC RANK
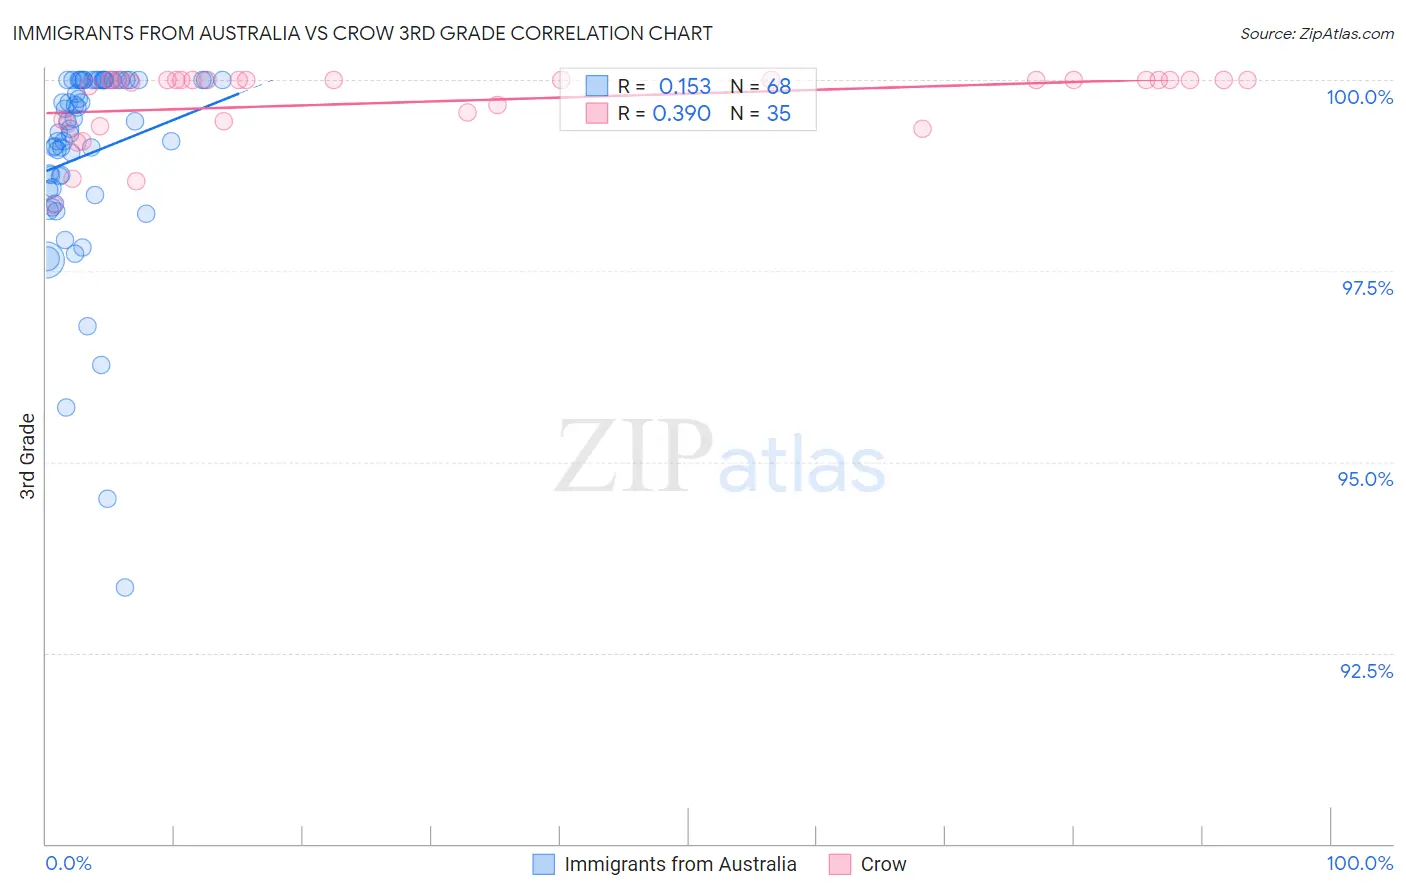
Immigrants from Australia vs Crow 3rd Grade Correlation Chart
The statistical analysis conducted on geographies consisting of 227,203,469 people shows a poor positive correlation between the proportion of Immigrants from Australia and percentage of population with at least 3rd grade education in the United States with a correlation coefficient (R) of 0.153 and weighted average of 98.1%. Similarly, the statistical analysis conducted on geographies consisting of 665,246 people shows a mild positive correlation between the proportion of Crow and percentage of population with at least 3rd grade education in the United States with a correlation coefficient (R) of 0.390 and weighted average of 99.6%, a difference of 1.5%.
3rd Grade Correlation Summary
| Measurement | Immigrants from Australia | Crow |
| Minimum | 93.4% | 98.4% |
| Maximum | 100.0% | 100.0% |
| Range | 6.6% | 1.6% |
| Mean | 99.0% | 99.7% |
| Median | 99.4% | 100.0% |
| Interquartile 25% (IQ1) | 98.6% | 99.5% |
| Interquartile 75% (IQ3) | 100.0% | 100.0% |
| Interquartile Range (IQR) | 1.4% | 0.53% |
| Standard Deviation (Sample) | 1.3% | 0.44% |
| Standard Deviation (Population) | 1.3% | 0.44% |
Similar Demographics by 3rd Grade
Demographics Similar to Immigrants from Australia by 3rd Grade
In terms of 3rd grade, the demographic groups most similar to Immigrants from Australia are Immigrants from Sweden (98.1%, a difference of 0.0%), Potawatomi (98.1%, a difference of 0.0%), Immigrants from Denmark (98.1%, a difference of 0.0%), Immigrants from India (98.1%, a difference of 0.0%), and Delaware (98.1%, a difference of 0.0%).
| Demographics | Rating | Rank | 3rd Grade |
| Osage | 99.2 /100 | #78 | Exceptional 98.2% |
| Immigrants | Belgium | 99.1 /100 | #79 | Exceptional 98.1% |
| Macedonians | 99.1 /100 | #80 | Exceptional 98.1% |
| Icelanders | 99.1 /100 | #81 | Exceptional 98.1% |
| Shoshone | 99.0 /100 | #82 | Exceptional 98.1% |
| Ukrainians | 98.9 /100 | #83 | Exceptional 98.1% |
| Immigrants | Sweden | 98.9 /100 | #84 | Exceptional 98.1% |
| Immigrants | Australia | 98.9 /100 | #85 | Exceptional 98.1% |
| Potawatomi | 98.9 /100 | #86 | Exceptional 98.1% |
| Immigrants | Denmark | 98.8 /100 | #87 | Exceptional 98.1% |
| Immigrants | India | 98.8 /100 | #88 | Exceptional 98.1% |
| Delaware | 98.8 /100 | #89 | Exceptional 98.1% |
| Zimbabweans | 98.8 /100 | #90 | Exceptional 98.1% |
| Hopi | 98.7 /100 | #91 | Exceptional 98.1% |
| Immigrants | South Africa | 98.7 /100 | #92 | Exceptional 98.1% |
Demographics Similar to Crow by 3rd Grade
In terms of 3rd grade, the demographic groups most similar to Crow are Yup'ik (99.0%, a difference of 0.60%), Welsh (98.8%, a difference of 0.84%), Inupiat (98.8%, a difference of 0.86%), Tsimshian (98.8%, a difference of 0.87%), and Alaskan Athabascan (98.7%, a difference of 0.97%).
| Demographics | Rating | Rank | 3rd Grade |
| Crow | 100.0 /100 | #1 | Exceptional 99.6% |
| Yup'ik | 100.0 /100 | #2 | Exceptional 99.0% |
| Welsh | 100.0 /100 | #3 | Exceptional 98.8% |
| Inupiat | 100.0 /100 | #4 | Exceptional 98.8% |
| Tsimshian | 100.0 /100 | #5 | Exceptional 98.8% |
| Alaskan Athabascans | 100.0 /100 | #6 | Exceptional 98.7% |
| Norwegians | 100.0 /100 | #7 | Exceptional 98.6% |
| Slovaks | 100.0 /100 | #8 | Exceptional 98.6% |
| Germans | 100.0 /100 | #9 | Exceptional 98.6% |
| Alaska Natives | 100.0 /100 | #10 | Exceptional 98.6% |
| Slovenes | 100.0 /100 | #11 | Exceptional 98.6% |
| English | 100.0 /100 | #12 | Exceptional 98.6% |
| Tlingit-Haida | 100.0 /100 | #13 | Exceptional 98.5% |
| Carpatho Rusyns | 100.0 /100 | #14 | Exceptional 98.5% |
| Swedes | 100.0 /100 | #15 | Exceptional 98.5% |