Immigrants from Australia vs Pima 3rd Grade
COMPARE
Immigrants from Australia
Pima
3rd Grade
3rd Grade Comparison
Immigrants from Australia
Pima
98.1%
3RD GRADE
98.9/ 100
METRIC RATING
85th/ 347
METRIC RANK
98.0%
3RD GRADE
96.7/ 100
METRIC RATING
109th/ 347
METRIC RANK
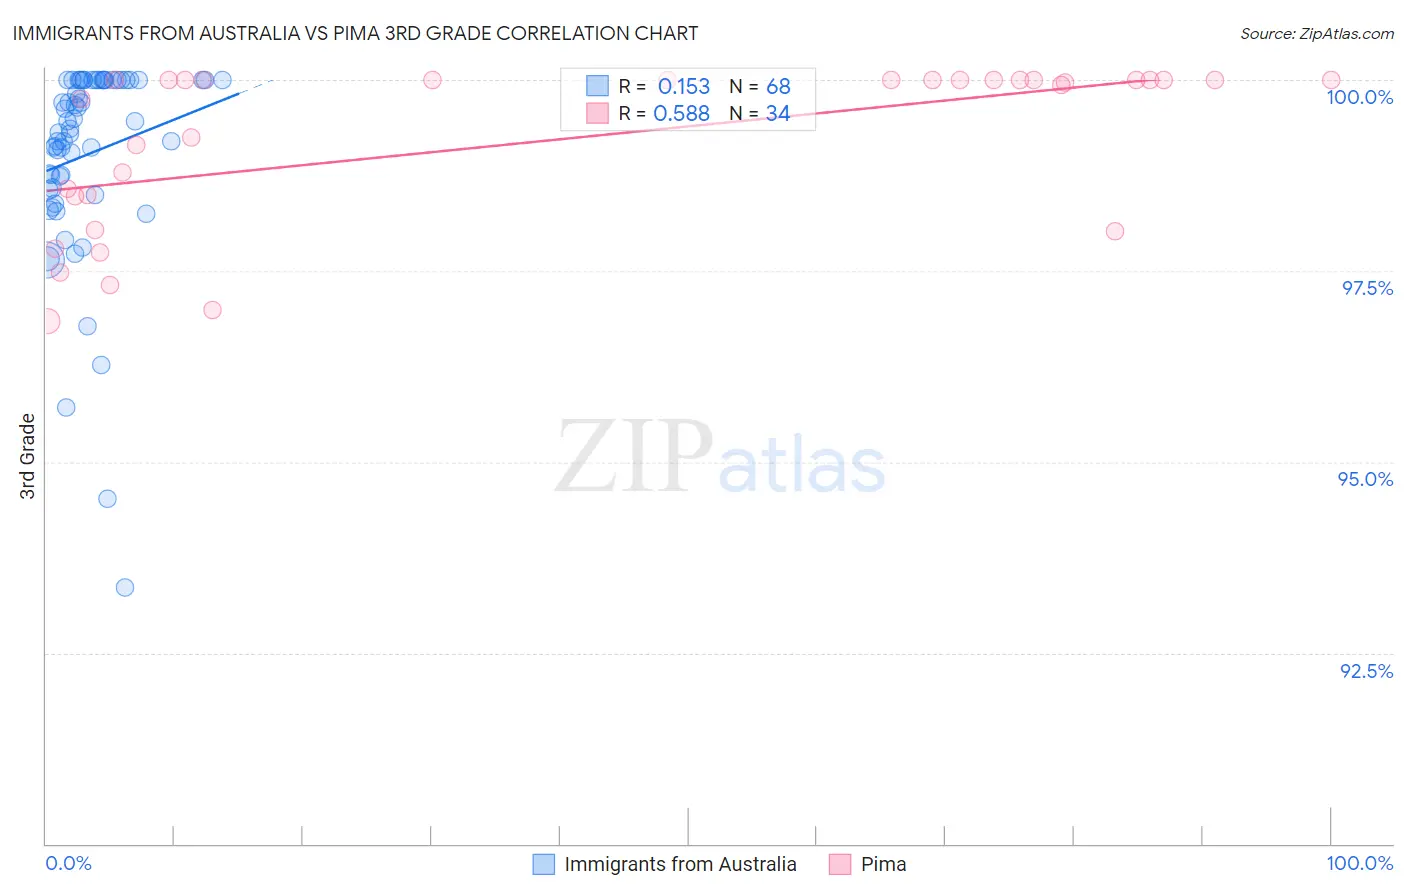
Immigrants from Australia vs Pima 3rd Grade Correlation Chart
The statistical analysis conducted on geographies consisting of 227,203,469 people shows a poor positive correlation between the proportion of Immigrants from Australia and percentage of population with at least 3rd grade education in the United States with a correlation coefficient (R) of 0.153 and weighted average of 98.1%. Similarly, the statistical analysis conducted on geographies consisting of 61,552,942 people shows a substantial positive correlation between the proportion of Pima and percentage of population with at least 3rd grade education in the United States with a correlation coefficient (R) of 0.588 and weighted average of 98.0%, a difference of 0.090%.
3rd Grade Correlation Summary
| Measurement | Immigrants from Australia | Pima |
| Minimum | 93.4% | 96.8% |
| Maximum | 100.0% | 100.0% |
| Range | 6.6% | 3.2% |
| Mean | 99.0% | 99.2% |
| Median | 99.4% | 100.0% |
| Interquartile 25% (IQ1) | 98.6% | 98.5% |
| Interquartile 75% (IQ3) | 100.0% | 100.0% |
| Interquartile Range (IQR) | 1.4% | 1.5% |
| Standard Deviation (Sample) | 1.3% | 1.1% |
| Standard Deviation (Population) | 1.3% | 1.1% |
Similar Demographics by 3rd Grade
Demographics Similar to Immigrants from Australia by 3rd Grade
In terms of 3rd grade, the demographic groups most similar to Immigrants from Australia are Immigrants from Sweden (98.1%, a difference of 0.0%), Potawatomi (98.1%, a difference of 0.0%), Immigrants from Denmark (98.1%, a difference of 0.0%), Immigrants from India (98.1%, a difference of 0.0%), and Delaware (98.1%, a difference of 0.0%).
| Demographics | Rating | Rank | 3rd Grade |
| Osage | 99.2 /100 | #78 | Exceptional 98.2% |
| Immigrants | Belgium | 99.1 /100 | #79 | Exceptional 98.1% |
| Macedonians | 99.1 /100 | #80 | Exceptional 98.1% |
| Icelanders | 99.1 /100 | #81 | Exceptional 98.1% |
| Shoshone | 99.0 /100 | #82 | Exceptional 98.1% |
| Ukrainians | 98.9 /100 | #83 | Exceptional 98.1% |
| Immigrants | Sweden | 98.9 /100 | #84 | Exceptional 98.1% |
| Immigrants | Australia | 98.9 /100 | #85 | Exceptional 98.1% |
| Potawatomi | 98.9 /100 | #86 | Exceptional 98.1% |
| Immigrants | Denmark | 98.8 /100 | #87 | Exceptional 98.1% |
| Immigrants | India | 98.8 /100 | #88 | Exceptional 98.1% |
| Delaware | 98.8 /100 | #89 | Exceptional 98.1% |
| Zimbabweans | 98.8 /100 | #90 | Exceptional 98.1% |
| Hopi | 98.7 /100 | #91 | Exceptional 98.1% |
| Immigrants | South Africa | 98.7 /100 | #92 | Exceptional 98.1% |
Demographics Similar to Pima by 3rd Grade
In terms of 3rd grade, the demographic groups most similar to Pima are Immigrants from Singapore (98.0%, a difference of 0.0%), Immigrants from Switzerland (98.0%, a difference of 0.0%), German Russian (98.1%, a difference of 0.010%), Bhutanese (98.1%, a difference of 0.010%), and Immigrants from Czechoslovakia (98.0%, a difference of 0.010%).
| Demographics | Rating | Rank | 3rd Grade |
| Immigrants | Nonimmigrants | 97.8 /100 | #102 | Exceptional 98.1% |
| Yugoslavians | 97.7 /100 | #103 | Exceptional 98.1% |
| Turks | 97.6 /100 | #104 | Exceptional 98.1% |
| German Russians | 97.2 /100 | #105 | Exceptional 98.1% |
| Bhutanese | 97.2 /100 | #106 | Exceptional 98.1% |
| Immigrants | Czechoslovakia | 97.0 /100 | #107 | Exceptional 98.0% |
| Immigrants | Singapore | 96.7 /100 | #108 | Exceptional 98.0% |
| Pima | 96.7 /100 | #109 | Exceptional 98.0% |
| Immigrants | Switzerland | 96.6 /100 | #110 | Exceptional 98.0% |
| Basques | 96.5 /100 | #111 | Exceptional 98.0% |
| Immigrants | Latvia | 96.0 /100 | #112 | Exceptional 98.0% |
| Thais | 95.5 /100 | #113 | Exceptional 98.0% |
| Menominee | 95.4 /100 | #114 | Exceptional 98.0% |
| Okinawans | 95.2 /100 | #115 | Exceptional 98.0% |
| Immigrants | Norway | 95.2 /100 | #116 | Exceptional 98.0% |