Immigrants from Australia vs Immigrants from Korea 3rd Grade
COMPARE
Immigrants from Australia
Immigrants from Korea
3rd Grade
3rd Grade Comparison
Immigrants from Australia
Immigrants from Korea
98.1%
3RD GRADE
98.9/ 100
METRIC RATING
85th/ 347
METRIC RANK
97.8%
3RD GRADE
50.9/ 100
METRIC RATING
173rd/ 347
METRIC RANK
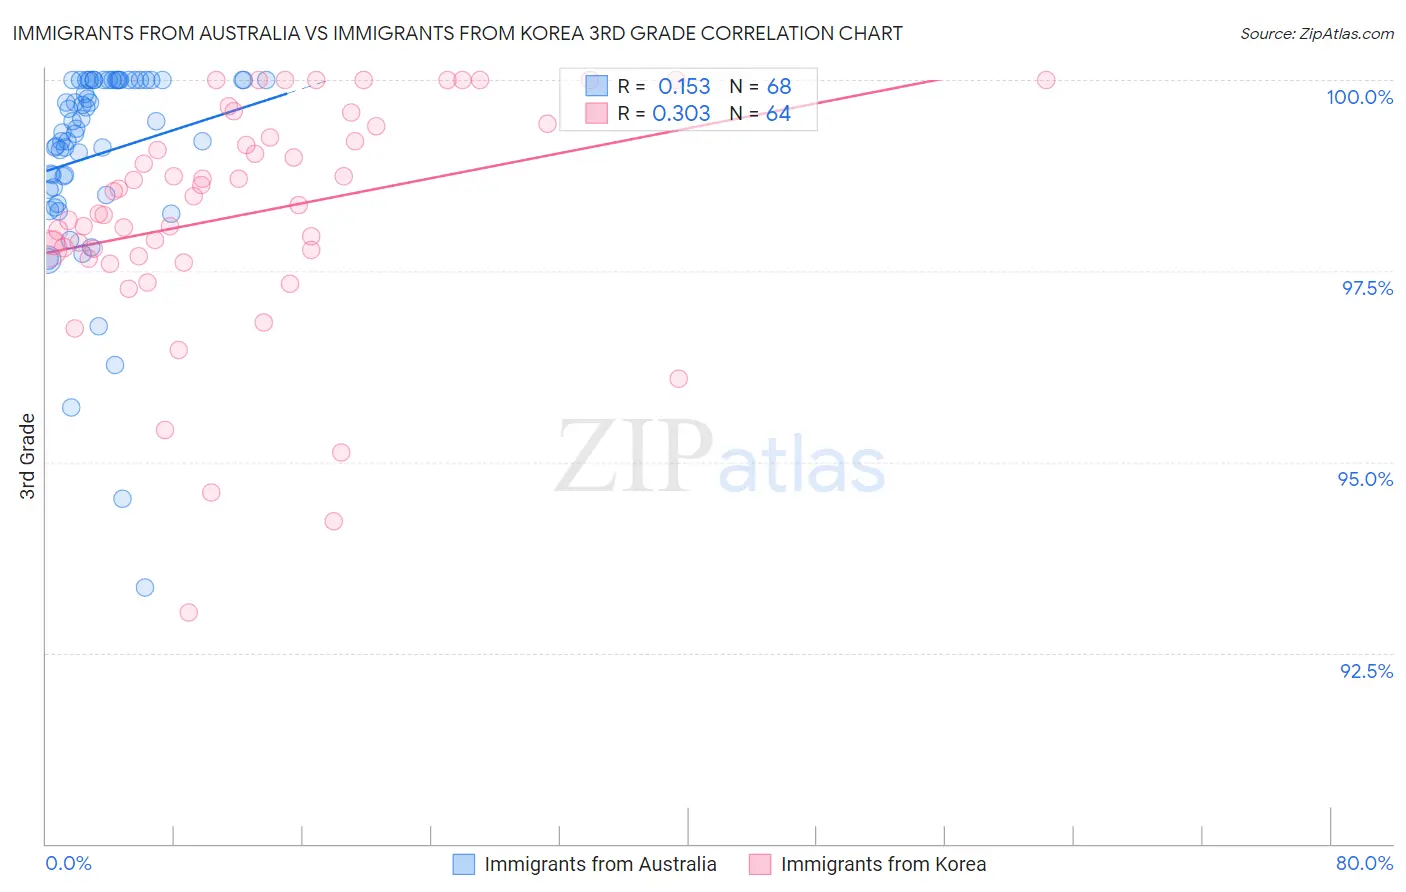
Immigrants from Australia vs Immigrants from Korea 3rd Grade Correlation Chart
The statistical analysis conducted on geographies consisting of 227,203,469 people shows a poor positive correlation between the proportion of Immigrants from Australia and percentage of population with at least 3rd grade education in the United States with a correlation coefficient (R) of 0.153 and weighted average of 98.1%. Similarly, the statistical analysis conducted on geographies consisting of 416,280,076 people shows a mild positive correlation between the proportion of Immigrants from Korea and percentage of population with at least 3rd grade education in the United States with a correlation coefficient (R) of 0.303 and weighted average of 97.8%, a difference of 0.38%.
3rd Grade Correlation Summary
| Measurement | Immigrants from Australia | Immigrants from Korea |
| Minimum | 93.4% | 93.0% |
| Maximum | 100.0% | 100.0% |
| Range | 6.6% | 7.0% |
| Mean | 99.0% | 98.3% |
| Median | 99.4% | 98.4% |
| Interquartile 25% (IQ1) | 98.6% | 97.7% |
| Interquartile 75% (IQ3) | 100.0% | 99.3% |
| Interquartile Range (IQR) | 1.4% | 1.6% |
| Standard Deviation (Sample) | 1.3% | 1.5% |
| Standard Deviation (Population) | 1.3% | 1.5% |
Similar Demographics by 3rd Grade
Demographics Similar to Immigrants from Australia by 3rd Grade
In terms of 3rd grade, the demographic groups most similar to Immigrants from Australia are Immigrants from Sweden (98.1%, a difference of 0.0%), Potawatomi (98.1%, a difference of 0.0%), Immigrants from Denmark (98.1%, a difference of 0.0%), Immigrants from India (98.1%, a difference of 0.0%), and Delaware (98.1%, a difference of 0.0%).
| Demographics | Rating | Rank | 3rd Grade |
| Osage | 99.2 /100 | #78 | Exceptional 98.2% |
| Immigrants | Belgium | 99.1 /100 | #79 | Exceptional 98.1% |
| Macedonians | 99.1 /100 | #80 | Exceptional 98.1% |
| Icelanders | 99.1 /100 | #81 | Exceptional 98.1% |
| Shoshone | 99.0 /100 | #82 | Exceptional 98.1% |
| Ukrainians | 98.9 /100 | #83 | Exceptional 98.1% |
| Immigrants | Sweden | 98.9 /100 | #84 | Exceptional 98.1% |
| Immigrants | Australia | 98.9 /100 | #85 | Exceptional 98.1% |
| Potawatomi | 98.9 /100 | #86 | Exceptional 98.1% |
| Immigrants | Denmark | 98.8 /100 | #87 | Exceptional 98.1% |
| Immigrants | India | 98.8 /100 | #88 | Exceptional 98.1% |
| Delaware | 98.8 /100 | #89 | Exceptional 98.1% |
| Zimbabweans | 98.8 /100 | #90 | Exceptional 98.1% |
| Hopi | 98.7 /100 | #91 | Exceptional 98.1% |
| Immigrants | South Africa | 98.7 /100 | #92 | Exceptional 98.1% |
Demographics Similar to Immigrants from Korea by 3rd Grade
In terms of 3rd grade, the demographic groups most similar to Immigrants from Korea are Kenyan (97.8%, a difference of 0.0%), Spanish American (97.8%, a difference of 0.0%), Navajo (97.8%, a difference of 0.0%), Chilean (97.8%, a difference of 0.010%), and Immigrants from Spain (97.8%, a difference of 0.010%).
| Demographics | Rating | Rank | 3rd Grade |
| Dutch West Indians | 55.5 /100 | #166 | Average 97.8% |
| Chileans | 55.3 /100 | #167 | Average 97.8% |
| Immigrants | Spain | 54.3 /100 | #168 | Average 97.8% |
| Comanche | 53.8 /100 | #169 | Average 97.8% |
| Brazilians | 53.7 /100 | #170 | Average 97.8% |
| Kenyans | 51.8 /100 | #171 | Average 97.8% |
| Spanish Americans | 51.8 /100 | #172 | Average 97.8% |
| Immigrants | Korea | 50.9 /100 | #173 | Average 97.8% |
| Navajo | 50.0 /100 | #174 | Average 97.8% |
| Immigrants | Micronesia | 47.6 /100 | #175 | Average 97.8% |
| Immigrants | Poland | 47.1 /100 | #176 | Average 97.8% |
| Egyptians | 46.6 /100 | #177 | Average 97.7% |
| Immigrants | Brazil | 46.4 /100 | #178 | Average 97.7% |
| Immigrants | Belarus | 45.9 /100 | #179 | Average 97.7% |
| Immigrants | Sri Lanka | 45.1 /100 | #180 | Average 97.7% |