Immigrants from Asia vs Immigrants from Romania Professional Degree
COMPARE
Immigrants from Asia
Immigrants from Romania
Professional Degree
Professional Degree Comparison
Immigrants from Asia
Immigrants from Romania
5.5%
PROFESSIONAL DEGREE
99.9/ 100
METRIC RATING
64th/ 347
METRIC RANK
5.4%
PROFESSIONAL DEGREE
99.8/ 100
METRIC RATING
73rd/ 347
METRIC RANK
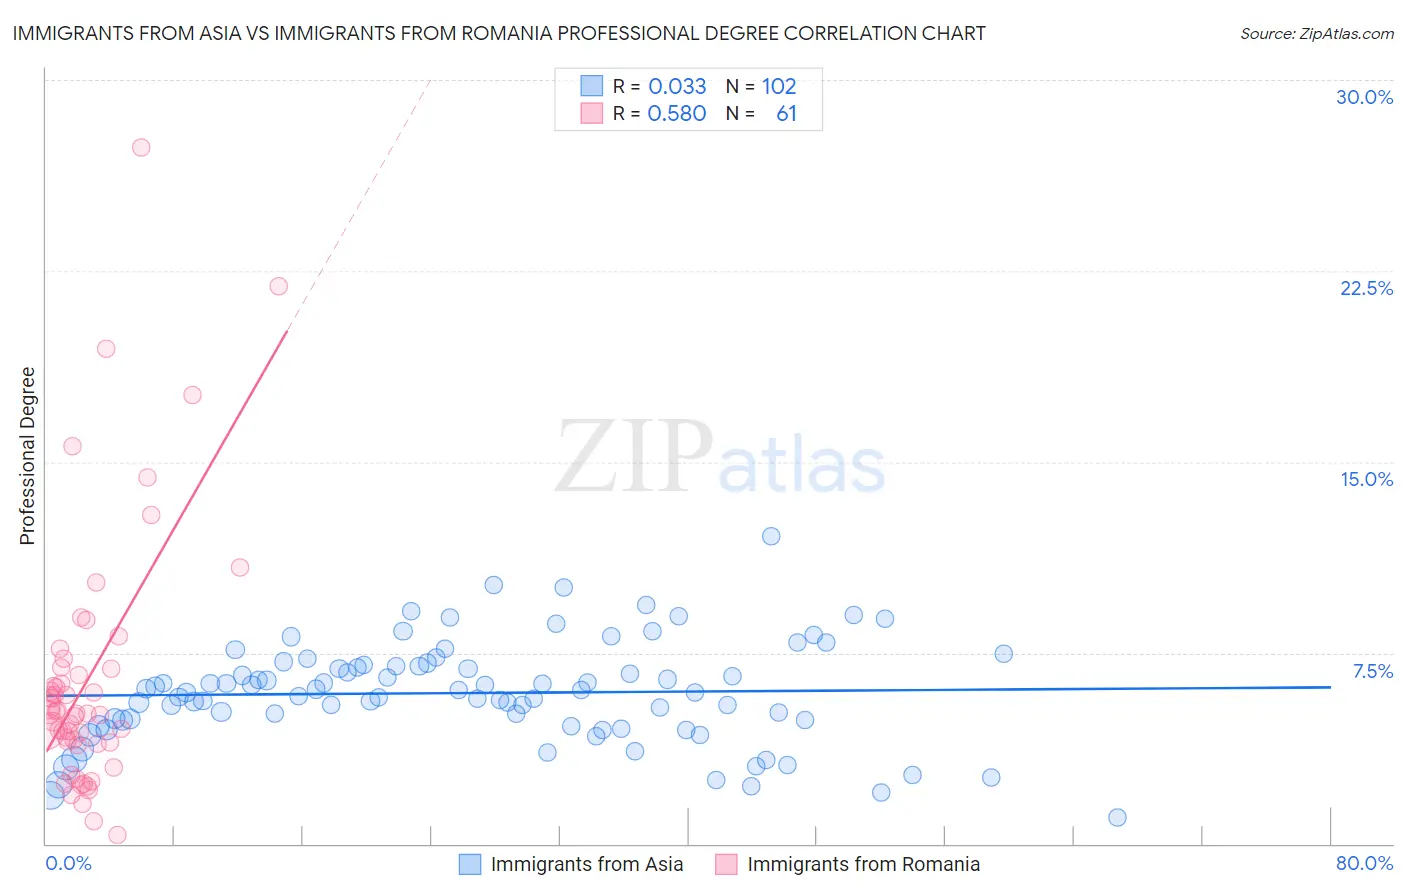
Immigrants from Asia vs Immigrants from Romania Professional Degree Correlation Chart
The statistical analysis conducted on geographies consisting of 544,872,863 people shows no correlation between the proportion of Immigrants from Asia and percentage of population with at least professional degree education in the United States with a correlation coefficient (R) of 0.033 and weighted average of 5.5%. Similarly, the statistical analysis conducted on geographies consisting of 256,846,441 people shows a substantial positive correlation between the proportion of Immigrants from Romania and percentage of population with at least professional degree education in the United States with a correlation coefficient (R) of 0.580 and weighted average of 5.4%, a difference of 2.4%.
Professional Degree Correlation Summary
| Measurement | Immigrants from Asia | Immigrants from Romania |
| Minimum | 1.1% | 0.34% |
| Maximum | 12.1% | 27.4% |
| Range | 11.0% | 27.0% |
| Mean | 5.9% | 6.5% |
| Median | 6.0% | 5.1% |
| Interquartile 25% (IQ1) | 4.9% | 4.0% |
| Interquartile 75% (IQ3) | 7.0% | 6.9% |
| Interquartile Range (IQR) | 2.1% | 2.9% |
| Standard Deviation (Sample) | 2.0% | 5.1% |
| Standard Deviation (Population) | 2.0% | 5.0% |
Demographics Similar to Immigrants from Asia and Immigrants from Romania by Professional Degree
In terms of professional degree, the demographic groups most similar to Immigrants from Asia are Asian (5.5%, a difference of 0.060%), Immigrants from Bolivia (5.5%, a difference of 0.060%), Immigrants from Kazakhstan (5.5%, a difference of 0.30%), Immigrants from Belarus (5.5%, a difference of 0.49%), and Immigrants from Bulgaria (5.5%, a difference of 0.62%). Similarly, the demographic groups most similar to Immigrants from Romania are Lithuanian (5.4%, a difference of 0.10%), Ethiopian (5.4%, a difference of 0.38%), Immigrants from Indonesia (5.3%, a difference of 0.51%), Immigrants from Western Asia (5.4%, a difference of 0.58%), and Immigrants from Canada (5.3%, a difference of 0.60%).
| Demographics | Rating | Rank | Professional Degree |
| Bulgarians | 100.0 /100 | #58 | Exceptional 5.7% |
| Immigrants | Europe | 100.0 /100 | #59 | Exceptional 5.6% |
| Bolivians | 99.9 /100 | #60 | Exceptional 5.6% |
| Immigrants | Lithuania | 99.9 /100 | #61 | Exceptional 5.6% |
| Immigrants | Belarus | 99.9 /100 | #62 | Exceptional 5.5% |
| Asians | 99.9 /100 | #63 | Exceptional 5.5% |
| Immigrants | Asia | 99.9 /100 | #64 | Exceptional 5.5% |
| Immigrants | Bolivia | 99.9 /100 | #65 | Exceptional 5.5% |
| Immigrants | Kazakhstan | 99.9 /100 | #66 | Exceptional 5.5% |
| Immigrants | Bulgaria | 99.9 /100 | #67 | Exceptional 5.5% |
| Immigrants | Lebanon | 99.9 /100 | #68 | Exceptional 5.5% |
| Immigrants | Hungary | 99.9 /100 | #69 | Exceptional 5.5% |
| Bhutanese | 99.8 /100 | #70 | Exceptional 5.4% |
| Immigrants | Western Asia | 99.8 /100 | #71 | Exceptional 5.4% |
| Lithuanians | 99.8 /100 | #72 | Exceptional 5.4% |
| Immigrants | Romania | 99.8 /100 | #73 | Exceptional 5.4% |
| Ethiopians | 99.7 /100 | #74 | Exceptional 5.4% |
| Immigrants | Indonesia | 99.7 /100 | #75 | Exceptional 5.3% |
| Immigrants | Canada | 99.7 /100 | #76 | Exceptional 5.3% |
| Immigrants | Ethiopia | 99.7 /100 | #77 | Exceptional 5.3% |
| Armenians | 99.7 /100 | #78 | Exceptional 5.3% |