Immigrants from Asia vs Northern European 1st Grade
COMPARE
Immigrants from Asia
Northern European
1st Grade
1st Grade Comparison
Immigrants from Asia
Northern Europeans
97.5%
1ST GRADE
0.7/ 100
METRIC RATING
254th/ 347
METRIC RANK
98.5%
1ST GRADE
99.9/ 100
METRIC RATING
44th/ 347
METRIC RANK
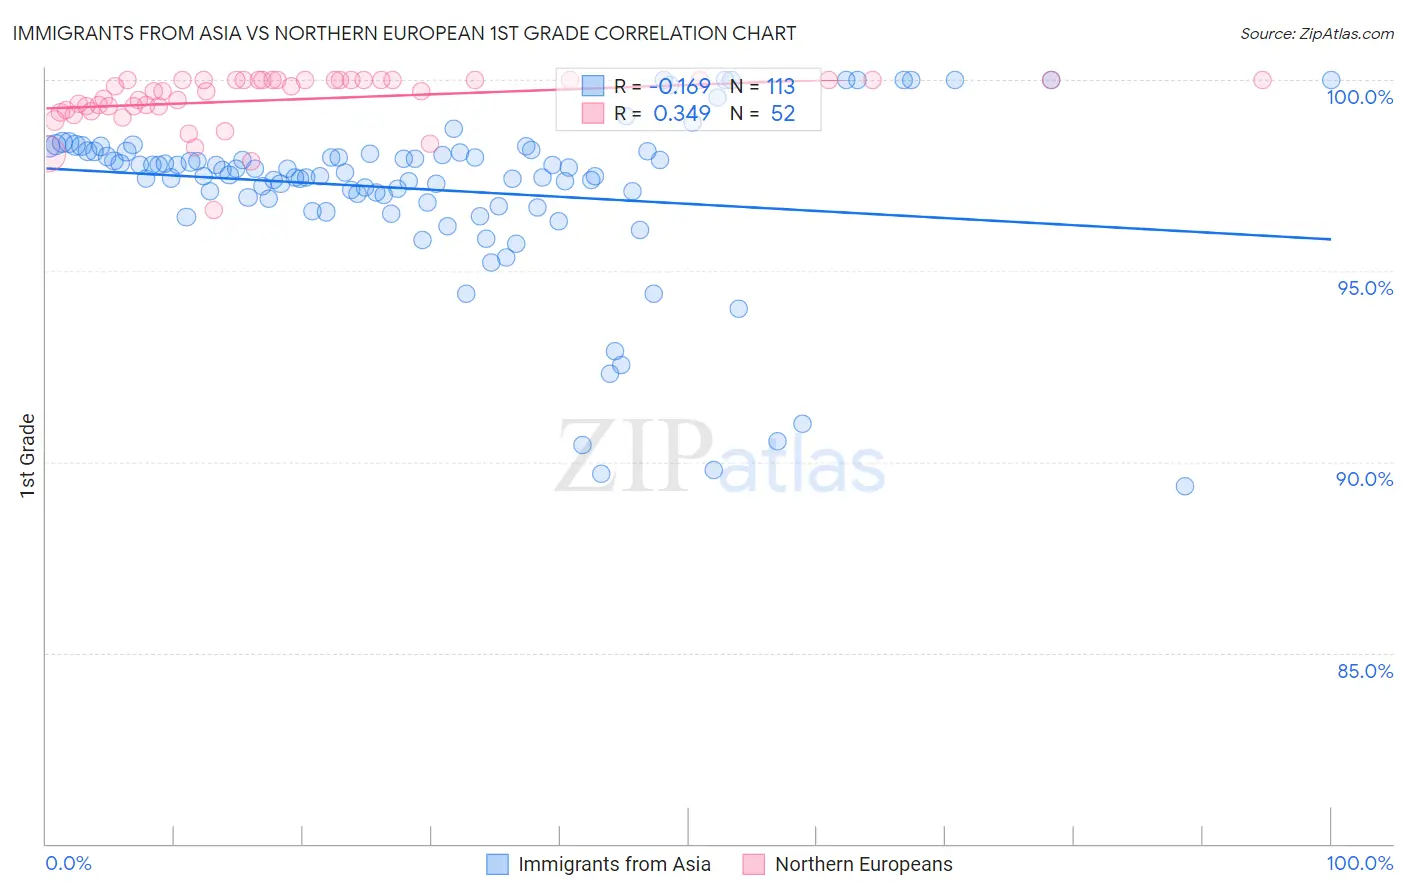
Immigrants from Asia vs Northern European 1st Grade Correlation Chart
The statistical analysis conducted on geographies consisting of 549,170,546 people shows a poor negative correlation between the proportion of Immigrants from Asia and percentage of population with at least 1st grade education in the United States with a correlation coefficient (R) of -0.169 and weighted average of 97.5%. Similarly, the statistical analysis conducted on geographies consisting of 406,093,361 people shows a mild positive correlation between the proportion of Northern Europeans and percentage of population with at least 1st grade education in the United States with a correlation coefficient (R) of 0.349 and weighted average of 98.5%, a difference of 0.93%.
1st Grade Correlation Summary
| Measurement | Immigrants from Asia | Northern European |
| Minimum | 89.4% | 96.6% |
| Maximum | 100.0% | 100.0% |
| Range | 10.6% | 3.4% |
| Mean | 97.1% | 99.5% |
| Median | 97.6% | 99.7% |
| Interquartile 25% (IQ1) | 96.8% | 99.3% |
| Interquartile 75% (IQ3) | 98.1% | 100.0% |
| Interquartile Range (IQR) | 1.3% | 0.74% |
| Standard Deviation (Sample) | 2.2% | 0.70% |
| Standard Deviation (Population) | 2.2% | 0.69% |
Similar Demographics by 1st Grade
Demographics Similar to Immigrants from Asia by 1st Grade
In terms of 1st grade, the demographic groups most similar to Immigrants from Asia are Immigrants from Congo (97.5%, a difference of 0.0%), Immigrants from Africa (97.6%, a difference of 0.010%), Immigrants from Colombia (97.5%, a difference of 0.010%), Jamaican (97.5%, a difference of 0.010%), and Ethiopian (97.6%, a difference of 0.020%).
| Demographics | Rating | Rank | 1st Grade |
| Peruvians | 1.0 /100 | #247 | Tragic 97.6% |
| Immigrants | Middle Africa | 1.0 /100 | #248 | Tragic 97.6% |
| Immigrants | Senegal | 1.0 /100 | #249 | Tragic 97.6% |
| Ethiopians | 0.9 /100 | #250 | Tragic 97.6% |
| Immigrants | Iraq | 0.9 /100 | #251 | Tragic 97.6% |
| Immigrants | Africa | 0.9 /100 | #252 | Tragic 97.6% |
| Immigrants | Congo | 0.7 /100 | #253 | Tragic 97.5% |
| Immigrants | Asia | 0.7 /100 | #254 | Tragic 97.5% |
| Immigrants | Colombia | 0.6 /100 | #255 | Tragic 97.5% |
| Jamaicans | 0.6 /100 | #256 | Tragic 97.5% |
| Yaqui | 0.6 /100 | #257 | Tragic 97.5% |
| Indians (Asian) | 0.6 /100 | #258 | Tragic 97.5% |
| Fijians | 0.5 /100 | #259 | Tragic 97.5% |
| Armenians | 0.5 /100 | #260 | Tragic 97.5% |
| Immigrants | Ethiopia | 0.4 /100 | #261 | Tragic 97.5% |
Demographics Similar to Northern Europeans by 1st Grade
In terms of 1st grade, the demographic groups most similar to Northern Europeans are Lumbee (98.5%, a difference of 0.0%), Belgian (98.4%, a difference of 0.0%), Luxembourger (98.5%, a difference of 0.010%), Eastern European (98.5%, a difference of 0.010%), and Native Hawaiian (98.5%, a difference of 0.010%).
| Demographics | Rating | Rank | 1st Grade |
| Italians | 99.9 /100 | #37 | Exceptional 98.5% |
| Chippewa | 99.9 /100 | #38 | Exceptional 98.5% |
| Latvians | 99.9 /100 | #39 | Exceptional 98.5% |
| Luxembourgers | 99.9 /100 | #40 | Exceptional 98.5% |
| Eastern Europeans | 99.9 /100 | #41 | Exceptional 98.5% |
| Native Hawaiians | 99.9 /100 | #42 | Exceptional 98.5% |
| Lumbee | 99.9 /100 | #43 | Exceptional 98.5% |
| Northern Europeans | 99.9 /100 | #44 | Exceptional 98.5% |
| Belgians | 99.9 /100 | #45 | Exceptional 98.4% |
| Hungarians | 99.9 /100 | #46 | Exceptional 98.4% |
| Ottawa | 99.8 /100 | #47 | Exceptional 98.4% |
| Czechoslovakians | 99.8 /100 | #48 | Exceptional 98.4% |
| Celtics | 99.8 /100 | #49 | Exceptional 98.4% |
| Whites/Caucasians | 99.8 /100 | #50 | Exceptional 98.4% |
| Estonians | 99.8 /100 | #51 | Exceptional 98.4% |