Immigrants from Asia vs Menominee 1st Grade
COMPARE
Immigrants from Asia
Menominee
1st Grade
1st Grade Comparison
Immigrants from Asia
Menominee
97.5%
1ST GRADE
0.7/ 100
METRIC RATING
254th/ 347
METRIC RANK
98.1%
1ST GRADE
93.9/ 100
METRIC RATING
122nd/ 347
METRIC RANK
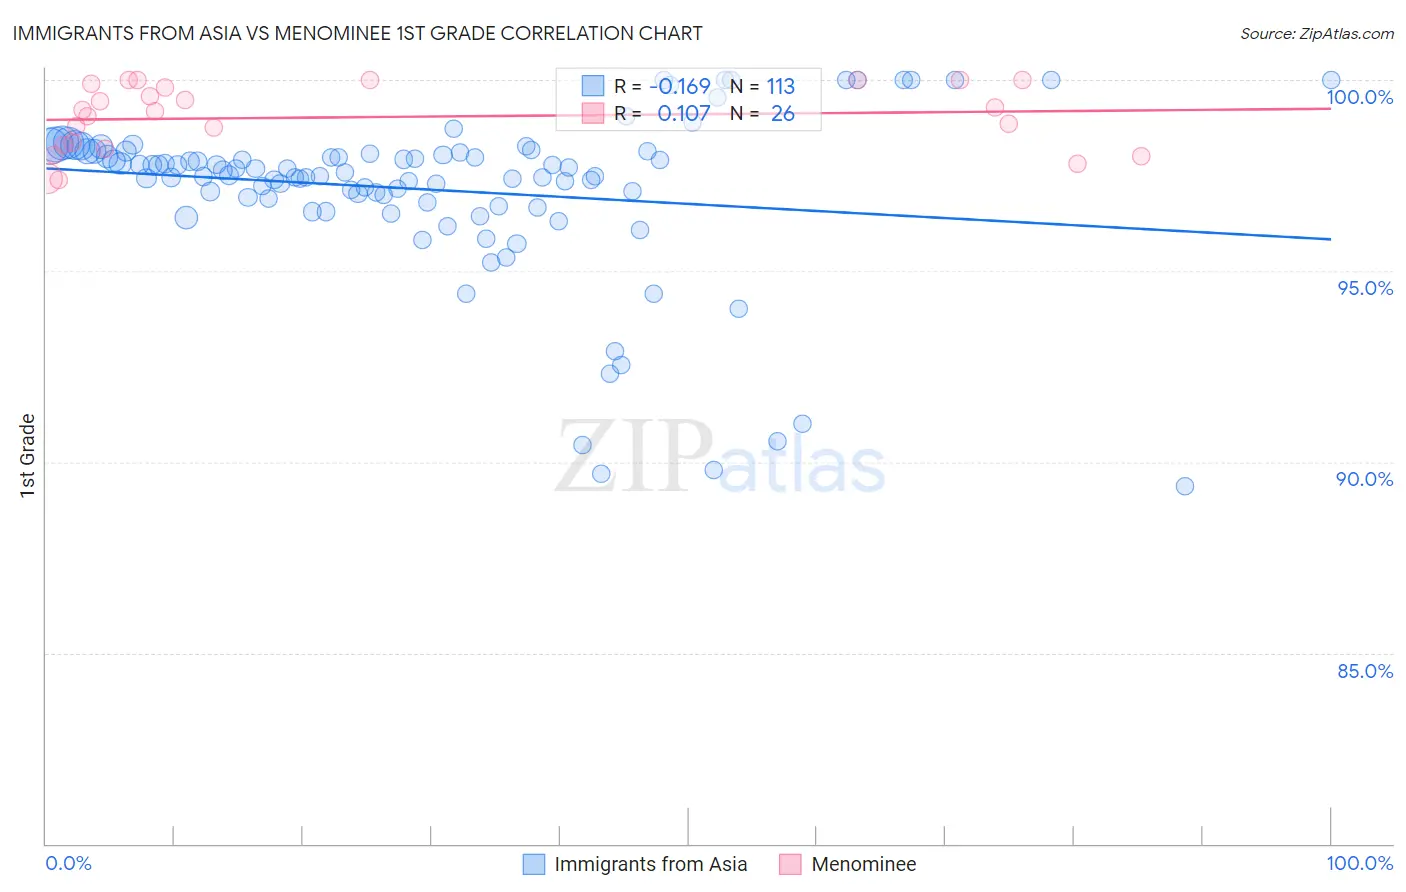
Immigrants from Asia vs Menominee 1st Grade Correlation Chart
The statistical analysis conducted on geographies consisting of 549,170,546 people shows a poor negative correlation between the proportion of Immigrants from Asia and percentage of population with at least 1st grade education in the United States with a correlation coefficient (R) of -0.169 and weighted average of 97.5%. Similarly, the statistical analysis conducted on geographies consisting of 45,778,979 people shows a poor positive correlation between the proportion of Menominee and percentage of population with at least 1st grade education in the United States with a correlation coefficient (R) of 0.107 and weighted average of 98.1%, a difference of 0.60%.
1st Grade Correlation Summary
| Measurement | Immigrants from Asia | Menominee |
| Minimum | 89.4% | 97.4% |
| Maximum | 100.0% | 100.0% |
| Range | 10.6% | 2.6% |
| Mean | 97.1% | 99.0% |
| Median | 97.6% | 99.2% |
| Interquartile 25% (IQ1) | 96.8% | 98.3% |
| Interquartile 75% (IQ3) | 98.1% | 99.9% |
| Interquartile Range (IQR) | 1.3% | 1.6% |
| Standard Deviation (Sample) | 2.2% | 0.86% |
| Standard Deviation (Population) | 2.2% | 0.85% |
Similar Demographics by 1st Grade
Demographics Similar to Immigrants from Asia by 1st Grade
In terms of 1st grade, the demographic groups most similar to Immigrants from Asia are Immigrants from Congo (97.5%, a difference of 0.0%), Immigrants from Africa (97.6%, a difference of 0.010%), Immigrants from Colombia (97.5%, a difference of 0.010%), Jamaican (97.5%, a difference of 0.010%), and Ethiopian (97.6%, a difference of 0.020%).
| Demographics | Rating | Rank | 1st Grade |
| Peruvians | 1.0 /100 | #247 | Tragic 97.6% |
| Immigrants | Middle Africa | 1.0 /100 | #248 | Tragic 97.6% |
| Immigrants | Senegal | 1.0 /100 | #249 | Tragic 97.6% |
| Ethiopians | 0.9 /100 | #250 | Tragic 97.6% |
| Immigrants | Iraq | 0.9 /100 | #251 | Tragic 97.6% |
| Immigrants | Africa | 0.9 /100 | #252 | Tragic 97.6% |
| Immigrants | Congo | 0.7 /100 | #253 | Tragic 97.5% |
| Immigrants | Asia | 0.7 /100 | #254 | Tragic 97.5% |
| Immigrants | Colombia | 0.6 /100 | #255 | Tragic 97.5% |
| Jamaicans | 0.6 /100 | #256 | Tragic 97.5% |
| Yaqui | 0.6 /100 | #257 | Tragic 97.5% |
| Indians (Asian) | 0.6 /100 | #258 | Tragic 97.5% |
| Fijians | 0.5 /100 | #259 | Tragic 97.5% |
| Armenians | 0.5 /100 | #260 | Tragic 97.5% |
| Immigrants | Ethiopia | 0.4 /100 | #261 | Tragic 97.5% |
Demographics Similar to Menominee by 1st Grade
In terms of 1st grade, the demographic groups most similar to Menominee are Immigrants from Zimbabwe (98.1%, a difference of 0.0%), Iroquois (98.1%, a difference of 0.0%), Syrian (98.1%, a difference of 0.0%), Immigrants from Japan (98.1%, a difference of 0.0%), and Thai (98.1%, a difference of 0.010%).
| Demographics | Rating | Rank | 1st Grade |
| Iranians | 96.0 /100 | #115 | Exceptional 98.2% |
| Spanish | 95.9 /100 | #116 | Exceptional 98.2% |
| Yugoslavians | 95.5 /100 | #117 | Exceptional 98.2% |
| Immigrants | France | 95.5 /100 | #118 | Exceptional 98.2% |
| Thais | 94.7 /100 | #119 | Exceptional 98.1% |
| Okinawans | 94.5 /100 | #120 | Exceptional 98.1% |
| Immigrants | Zimbabwe | 94.0 /100 | #121 | Exceptional 98.1% |
| Menominee | 93.9 /100 | #122 | Exceptional 98.1% |
| Iroquois | 93.8 /100 | #123 | Exceptional 98.1% |
| Syrians | 93.7 /100 | #124 | Exceptional 98.1% |
| Immigrants | Japan | 93.7 /100 | #125 | Exceptional 98.1% |
| Lebanese | 93.5 /100 | #126 | Exceptional 98.1% |
| Immigrants | Saudi Arabia | 93.3 /100 | #127 | Exceptional 98.1% |
| Immigrants | Serbia | 92.2 /100 | #128 | Exceptional 98.1% |
| Seminole | 91.9 /100 | #129 | Exceptional 98.1% |