Immigrants from Asia vs Northern European High School Diploma
COMPARE
Immigrants from Asia
Northern European
High School Diploma
High School Diploma Comparison
Immigrants from Asia
Northern Europeans
89.3%
HIGH SCHOOL DIPLOMA
59.8/ 100
METRIC RATING
165th/ 347
METRIC RANK
91.3%
HIGH SCHOOL DIPLOMA
99.8/ 100
METRIC RATING
42nd/ 347
METRIC RANK
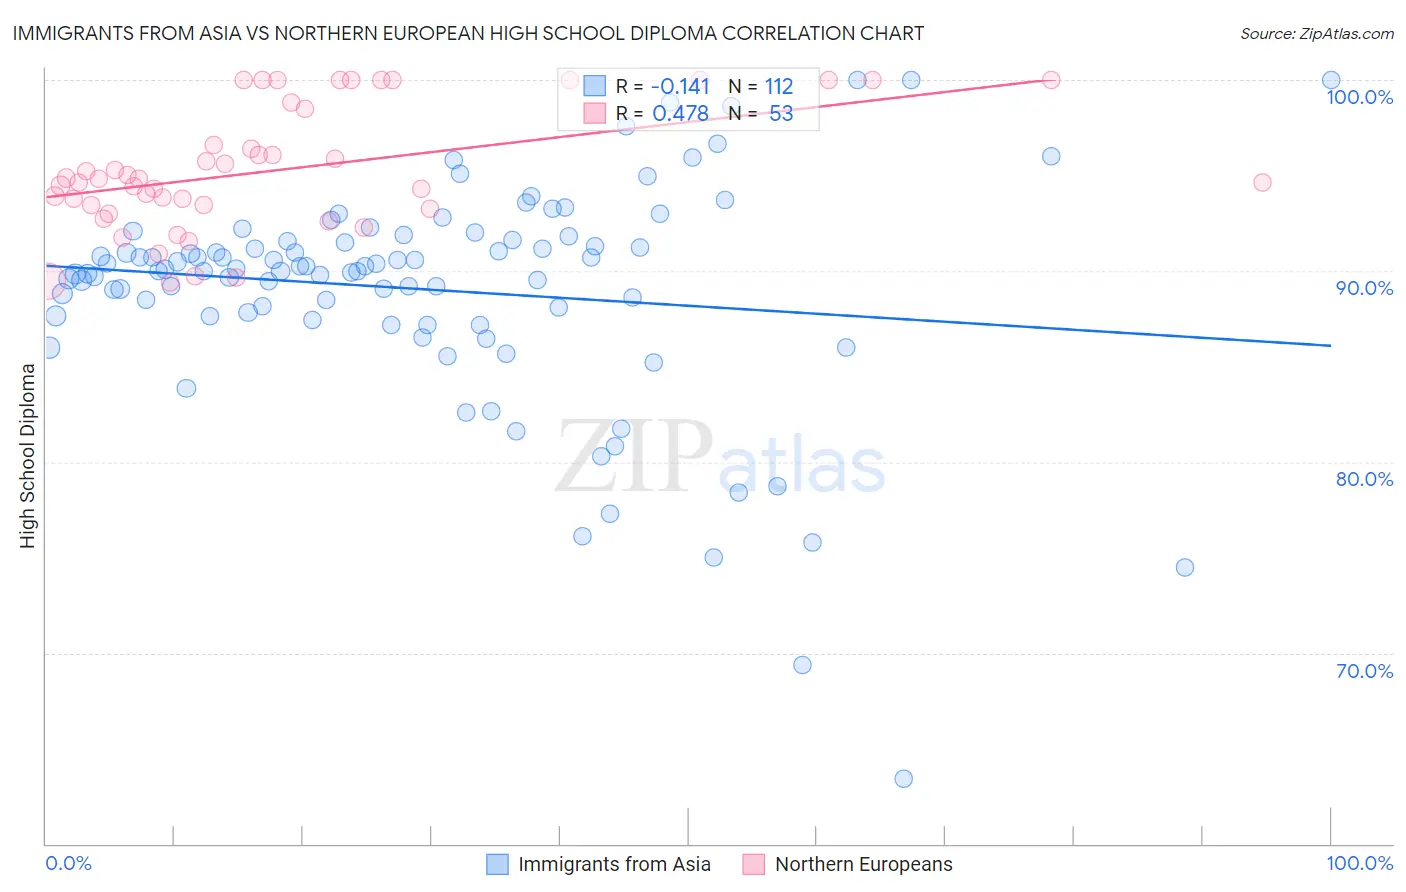
Immigrants from Asia vs Northern European High School Diploma Correlation Chart
The statistical analysis conducted on geographies consisting of 549,170,250 people shows a poor negative correlation between the proportion of Immigrants from Asia and percentage of population with at least high school diploma education in the United States with a correlation coefficient (R) of -0.141 and weighted average of 89.3%. Similarly, the statistical analysis conducted on geographies consisting of 406,096,351 people shows a moderate positive correlation between the proportion of Northern Europeans and percentage of population with at least high school diploma education in the United States with a correlation coefficient (R) of 0.478 and weighted average of 91.3%, a difference of 2.2%.
High School Diploma Correlation Summary
| Measurement | Immigrants from Asia | Northern European |
| Minimum | 63.4% | 89.4% |
| Maximum | 100.0% | 100.0% |
| Range | 36.6% | 10.6% |
| Mean | 89.0% | 95.3% |
| Median | 90.1% | 94.8% |
| Interquartile 25% (IQ1) | 87.7% | 93.4% |
| Interquartile 75% (IQ3) | 91.6% | 98.7% |
| Interquartile Range (IQR) | 3.9% | 5.3% |
| Standard Deviation (Sample) | 5.9% | 3.2% |
| Standard Deviation (Population) | 5.8% | 3.2% |
Similar Demographics by High School Diploma
Demographics Similar to Immigrants from Asia by High School Diploma
In terms of high school diploma, the demographic groups most similar to Immigrants from Asia are Immigrants from Albania (89.3%, a difference of 0.010%), Brazilian (89.3%, a difference of 0.020%), Bermudan (89.3%, a difference of 0.020%), Cree (89.3%, a difference of 0.020%), and Immigrants from Nepal (89.3%, a difference of 0.020%).
| Demographics | Rating | Rank | High School Diploma |
| Immigrants | Pakistan | 62.5 /100 | #158 | Good 89.3% |
| Immigrants | China | 62.0 /100 | #159 | Good 89.3% |
| Laotians | 61.8 /100 | #160 | Good 89.3% |
| Brazilians | 61.2 /100 | #161 | Good 89.3% |
| Bermudans | 61.1 /100 | #162 | Good 89.3% |
| Cree | 61.1 /100 | #163 | Good 89.3% |
| Immigrants | Nepal | 61.1 /100 | #164 | Good 89.3% |
| Immigrants | Asia | 59.8 /100 | #165 | Average 89.3% |
| Immigrants | Albania | 59.4 /100 | #166 | Average 89.3% |
| Immigrants | Hong Kong | 58.6 /100 | #167 | Average 89.3% |
| Delaware | 55.8 /100 | #168 | Average 89.2% |
| Iroquois | 55.1 /100 | #169 | Average 89.2% |
| Immigrants | Morocco | 53.3 /100 | #170 | Average 89.2% |
| Spanish | 52.9 /100 | #171 | Average 89.2% |
| Immigrants | Nonimmigrants | 51.8 /100 | #172 | Average 89.2% |
Demographics Similar to Northern Europeans by High School Diploma
In terms of high school diploma, the demographic groups most similar to Northern Europeans are Immigrants from Australia (91.3%, a difference of 0.010%), British (91.3%, a difference of 0.010%), Immigrants from Austria (91.3%, a difference of 0.020%), Turkish (91.2%, a difference of 0.020%), and Immigrants from Lithuania (91.3%, a difference of 0.030%).
| Demographics | Rating | Rank | High School Diploma |
| Irish | 99.9 /100 | #35 | Exceptional 91.4% |
| Tsimshian | 99.9 /100 | #36 | Exceptional 91.3% |
| Immigrants | Ireland | 99.9 /100 | #37 | Exceptional 91.3% |
| Immigrants | Scotland | 99.8 /100 | #38 | Exceptional 91.3% |
| Dutch | 99.8 /100 | #39 | Exceptional 91.3% |
| Immigrants | Lithuania | 99.8 /100 | #40 | Exceptional 91.3% |
| Immigrants | Australia | 99.8 /100 | #41 | Exceptional 91.3% |
| Northern Europeans | 99.8 /100 | #42 | Exceptional 91.3% |
| British | 99.8 /100 | #43 | Exceptional 91.3% |
| Immigrants | Austria | 99.8 /100 | #44 | Exceptional 91.3% |
| Turks | 99.8 /100 | #45 | Exceptional 91.2% |
| Greeks | 99.8 /100 | #46 | Exceptional 91.2% |
| Australians | 99.8 /100 | #47 | Exceptional 91.2% |
| Belgians | 99.8 /100 | #48 | Exceptional 91.2% |
| Bhutanese | 99.8 /100 | #49 | Exceptional 91.2% |