Immigrants from Argentina vs New Zealander Kindergarten
COMPARE
Immigrants from Argentina
New Zealander
Kindergarten
Kindergarten Comparison
Immigrants from Argentina
New Zealanders
97.9%
KINDERGARTEN
40.7/ 100
METRIC RATING
184th/ 347
METRIC RANK
98.4%
KINDERGARTEN
99.7/ 100
METRIC RATING
62nd/ 347
METRIC RANK
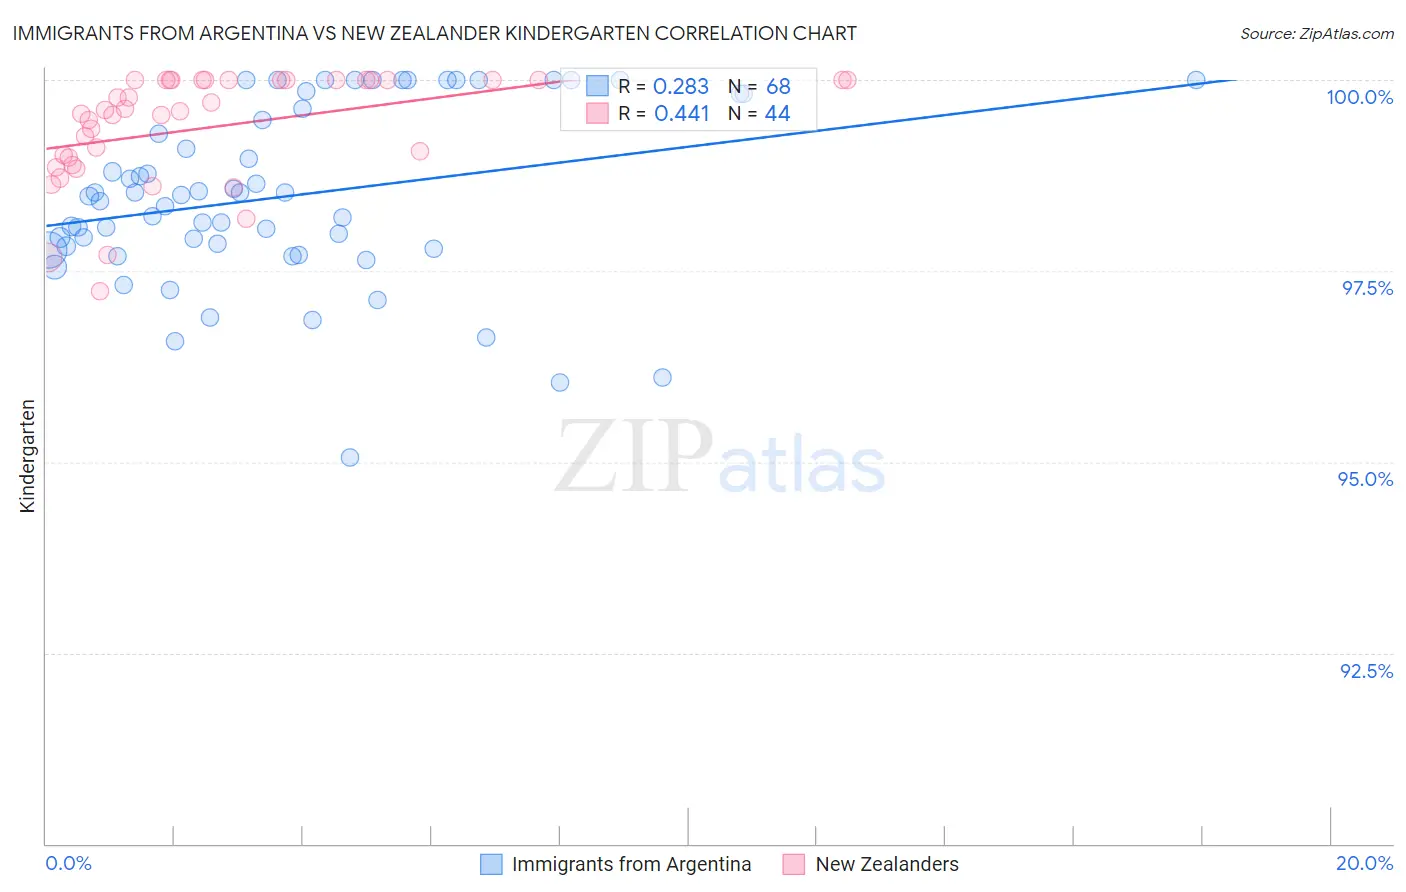
Immigrants from Argentina vs New Zealander Kindergarten Correlation Chart
The statistical analysis conducted on geographies consisting of 264,435,492 people shows a weak positive correlation between the proportion of Immigrants from Argentina and percentage of population with at least kindergarten education in the United States with a correlation coefficient (R) of 0.283 and weighted average of 97.9%. Similarly, the statistical analysis conducted on geographies consisting of 106,905,567 people shows a moderate positive correlation between the proportion of New Zealanders and percentage of population with at least kindergarten education in the United States with a correlation coefficient (R) of 0.441 and weighted average of 98.4%, a difference of 0.48%.
Kindergarten Correlation Summary
| Measurement | Immigrants from Argentina | New Zealander |
| Minimum | 95.1% | 97.2% |
| Maximum | 100.0% | 100.0% |
| Range | 4.9% | 2.8% |
| Mean | 98.5% | 99.4% |
| Median | 98.5% | 99.6% |
| Interquartile 25% (IQ1) | 97.8% | 98.9% |
| Interquartile 75% (IQ3) | 99.7% | 100.0% |
| Interquartile Range (IQR) | 1.9% | 1.1% |
| Standard Deviation (Sample) | 1.2% | 0.72% |
| Standard Deviation (Population) | 1.1% | 0.71% |
Similar Demographics by Kindergarten
Demographics Similar to Immigrants from Argentina by Kindergarten
In terms of kindergarten, the demographic groups most similar to Immigrants from Argentina are Immigrants from Poland (97.9%, a difference of 0.0%), Immigrants from Belarus (97.9%, a difference of 0.0%), Portuguese (97.9%, a difference of 0.010%), Egyptian (97.9%, a difference of 0.010%), and Immigrants from Venezuela (97.9%, a difference of 0.020%).
| Demographics | Rating | Rank | Kindergarten |
| Immigrants | Venezuela | 47.9 /100 | #177 | Average 97.9% |
| Brazilians | 47.6 /100 | #178 | Average 97.9% |
| Argentineans | 46.8 /100 | #179 | Average 97.9% |
| Immigrants | Bosnia and Herzegovina | 46.7 /100 | #180 | Average 97.9% |
| Portuguese | 43.5 /100 | #181 | Average 97.9% |
| Egyptians | 42.4 /100 | #182 | Average 97.9% |
| Immigrants | Poland | 41.4 /100 | #183 | Average 97.9% |
| Immigrants | Argentina | 40.7 /100 | #184 | Average 97.9% |
| Immigrants | Belarus | 39.4 /100 | #185 | Fair 97.9% |
| Pakistanis | 36.0 /100 | #186 | Fair 97.9% |
| Immigrants | Kazakhstan | 35.9 /100 | #187 | Fair 97.9% |
| Arabs | 35.4 /100 | #188 | Fair 97.9% |
| Paiute | 34.7 /100 | #189 | Fair 97.9% |
| Panamanians | 33.3 /100 | #190 | Fair 97.9% |
| Immigrants | Taiwan | 30.7 /100 | #191 | Fair 97.9% |
Demographics Similar to New Zealanders by Kindergarten
In terms of kindergarten, the demographic groups most similar to New Zealanders are Immigrants from Canada (98.4%, a difference of 0.0%), Creek (98.4%, a difference of 0.0%), Slavic (98.4%, a difference of 0.0%), Immigrants from North America (98.4%, a difference of 0.0%), and Greek (98.4%, a difference of 0.0%).
| Demographics | Rating | Rank | Kindergarten |
| Immigrants | Scotland | 99.8 /100 | #55 | Exceptional 98.4% |
| Americans | 99.8 /100 | #56 | Exceptional 98.4% |
| Austrians | 99.8 /100 | #57 | Exceptional 98.4% |
| Bulgarians | 99.7 /100 | #58 | Exceptional 98.4% |
| Immigrants | Canada | 99.7 /100 | #59 | Exceptional 98.4% |
| Creek | 99.7 /100 | #60 | Exceptional 98.4% |
| Slavs | 99.7 /100 | #61 | Exceptional 98.4% |
| New Zealanders | 99.7 /100 | #62 | Exceptional 98.4% |
| Immigrants | North America | 99.7 /100 | #63 | Exceptional 98.4% |
| Greeks | 99.7 /100 | #64 | Exceptional 98.4% |
| Maltese | 99.7 /100 | #65 | Exceptional 98.4% |
| Cheyenne | 99.6 /100 | #66 | Exceptional 98.4% |
| Canadians | 99.6 /100 | #67 | Exceptional 98.4% |
| Immigrants | Northern Europe | 99.6 /100 | #68 | Exceptional 98.4% |
| Immigrants | Austria | 99.6 /100 | #69 | Exceptional 98.4% |