Immigrants from Albania vs Israeli 7th Grade
COMPARE
Immigrants from Albania
Israeli
7th Grade
7th Grade Comparison
Immigrants from Albania
Israelis
96.0%
7TH GRADE
50.4/ 100
METRIC RATING
173rd/ 347
METRIC RANK
96.3%
7TH GRADE
82.8/ 100
METRIC RATING
148th/ 347
METRIC RANK
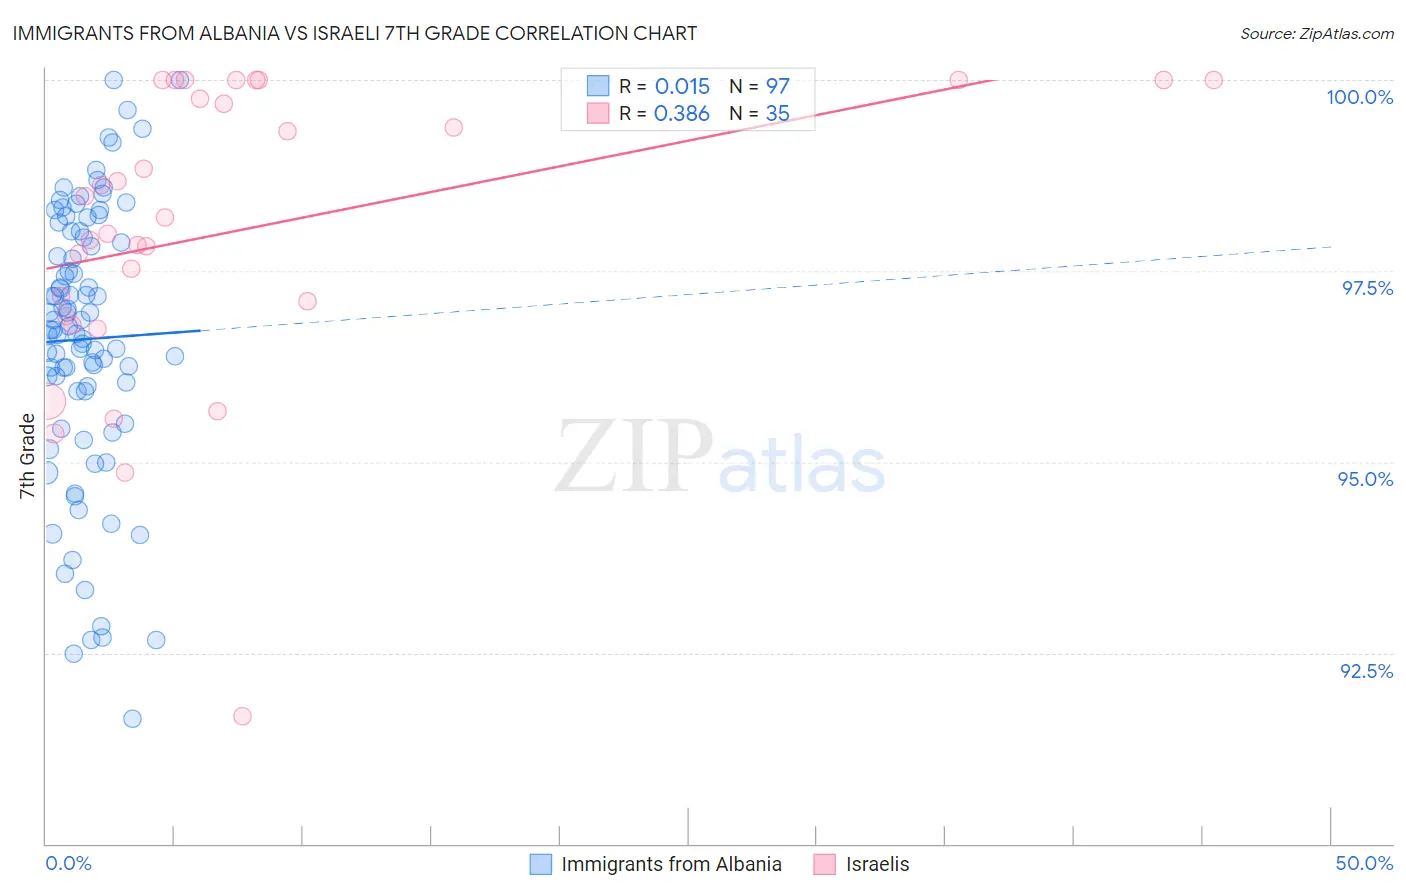
Immigrants from Albania vs Israeli 7th Grade Correlation Chart
The statistical analysis conducted on geographies consisting of 119,265,453 people shows no correlation between the proportion of Immigrants from Albania and percentage of population with at least 7th grade education in the United States with a correlation coefficient (R) of 0.015 and weighted average of 96.0%. Similarly, the statistical analysis conducted on geographies consisting of 211,220,151 people shows a mild positive correlation between the proportion of Israelis and percentage of population with at least 7th grade education in the United States with a correlation coefficient (R) of 0.386 and weighted average of 96.3%, a difference of 0.24%.
7th Grade Correlation Summary
| Measurement | Immigrants from Albania | Israeli |
| Minimum | 91.6% | 91.7% |
| Maximum | 100.0% | 100.0% |
| Range | 8.4% | 8.3% |
| Mean | 96.6% | 98.0% |
| Median | 96.7% | 98.2% |
| Interquartile 25% (IQ1) | 95.9% | 96.9% |
| Interquartile 75% (IQ3) | 98.0% | 100.0% |
| Interquartile Range (IQR) | 2.0% | 3.1% |
| Standard Deviation (Sample) | 1.8% | 1.9% |
| Standard Deviation (Population) | 1.8% | 1.9% |
Similar Demographics by 7th Grade
Demographics Similar to Immigrants from Albania by 7th Grade
In terms of 7th grade, the demographic groups most similar to Immigrants from Albania are Mongolian (96.0%, a difference of 0.0%), Venezuelan (96.0%, a difference of 0.010%), Black/African American (96.0%, a difference of 0.010%), Chilean (96.0%, a difference of 0.010%), and Immigrants from Korea (96.0%, a difference of 0.010%).
| Demographics | Rating | Rank | 7th Grade |
| Immigrants | Kazakhstan | 61.0 /100 | #166 | Good 96.1% |
| Immigrants | Sri Lanka | 59.9 /100 | #167 | Average 96.1% |
| Immigrants | Poland | 59.0 /100 | #168 | Average 96.1% |
| Ute | 55.8 /100 | #169 | Average 96.1% |
| Immigrants | Ukraine | 55.0 /100 | #170 | Average 96.1% |
| Egyptians | 54.2 /100 | #171 | Average 96.1% |
| Venezuelans | 51.4 /100 | #172 | Average 96.0% |
| Immigrants | Albania | 50.4 /100 | #173 | Average 96.0% |
| Mongolians | 50.0 /100 | #174 | Average 96.0% |
| Blacks/African Americans | 49.5 /100 | #175 | Average 96.0% |
| Chileans | 49.3 /100 | #176 | Average 96.0% |
| Immigrants | Korea | 49.2 /100 | #177 | Average 96.0% |
| Marshallese | 48.4 /100 | #178 | Average 96.0% |
| Immigrants | Iran | 47.8 /100 | #179 | Average 96.0% |
| Immigrants | Brazil | 46.8 /100 | #180 | Average 96.0% |
Demographics Similar to Israelis by 7th Grade
In terms of 7th grade, the demographic groups most similar to Israelis are French American Indian (96.3%, a difference of 0.0%), Albanian (96.3%, a difference of 0.0%), Immigrants from Belarus (96.3%, a difference of 0.0%), Blackfeet (96.3%, a difference of 0.010%), and Immigrants from Eastern Europe (96.3%, a difference of 0.010%).
| Demographics | Rating | Rank | 7th Grade |
| Immigrants | South Central Asia | 87.1 /100 | #141 | Excellent 96.3% |
| Burmese | 87.1 /100 | #142 | Excellent 96.3% |
| Spanish | 86.6 /100 | #143 | Excellent 96.3% |
| Immigrants | Greece | 85.9 /100 | #144 | Excellent 96.3% |
| Blackfeet | 83.9 /100 | #145 | Excellent 96.3% |
| Immigrants | Eastern Europe | 83.7 /100 | #146 | Excellent 96.3% |
| French American Indians | 83.1 /100 | #147 | Excellent 96.3% |
| Israelis | 82.8 /100 | #148 | Excellent 96.3% |
| Albanians | 82.6 /100 | #149 | Excellent 96.3% |
| Immigrants | Belarus | 82.4 /100 | #150 | Excellent 96.3% |
| Hopi | 81.6 /100 | #151 | Excellent 96.3% |
| Immigrants | Russia | 78.4 /100 | #152 | Good 96.2% |
| Seminole | 78.1 /100 | #153 | Good 96.2% |
| Immigrants | Israel | 77.6 /100 | #154 | Good 96.2% |
| Immigrants | Jordan | 77.0 /100 | #155 | Good 96.2% |