Immigrants from Albania vs Immigrants from China In Labor Force | Age 45-54
COMPARE
Immigrants from Albania
Immigrants from China
In Labor Force | Age 45-54
In Labor Force | Age 45-54 Comparison
Immigrants from Albania
Immigrants from China
83.2%
IN LABOR FORCE | AGE 45-54
91.8/ 100
METRIC RATING
113th/ 347
METRIC RANK
83.2%
IN LABOR FORCE | AGE 45-54
90.9/ 100
METRIC RATING
117th/ 347
METRIC RANK
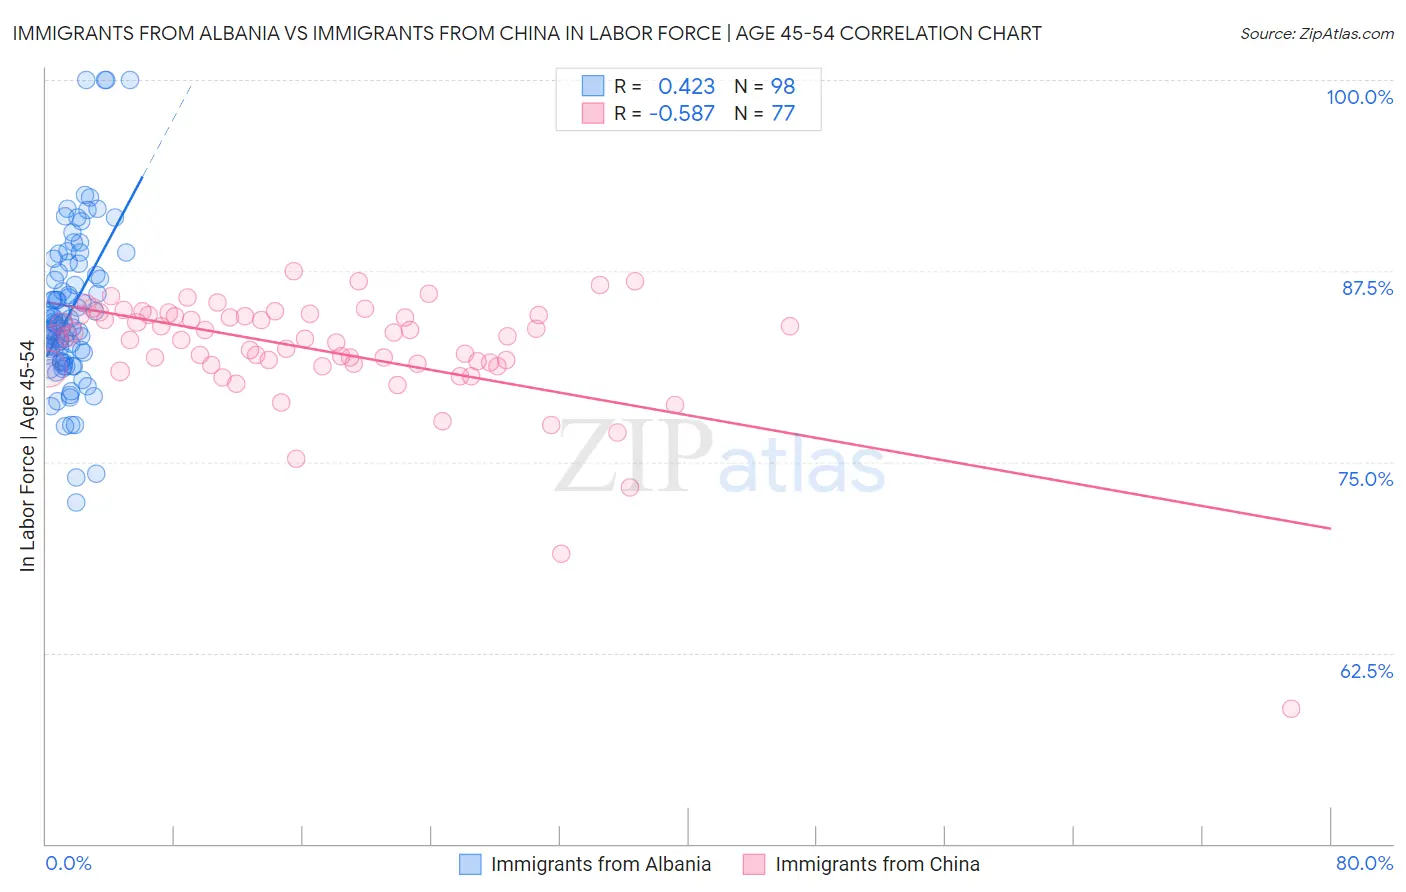
Immigrants from Albania vs Immigrants from China In Labor Force | Age 45-54 Correlation Chart
The statistical analysis conducted on geographies consisting of 119,388,252 people shows a moderate positive correlation between the proportion of Immigrants from Albania and labor force participation rate among population between the ages 45 and 54 in the United States with a correlation coefficient (R) of 0.423 and weighted average of 83.2%. Similarly, the statistical analysis conducted on geographies consisting of 456,555,548 people shows a substantial negative correlation between the proportion of Immigrants from China and labor force participation rate among population between the ages 45 and 54 in the United States with a correlation coefficient (R) of -0.587 and weighted average of 83.2%, a difference of 0.030%.
In Labor Force | Age 45-54 Correlation Summary
| Measurement | Immigrants from Albania | Immigrants from China |
| Minimum | 72.3% | 58.8% |
| Maximum | 100.0% | 87.5% |
| Range | 27.7% | 28.7% |
| Mean | 84.8% | 82.3% |
| Median | 84.0% | 83.1% |
| Interquartile 25% (IQ1) | 81.8% | 81.4% |
| Interquartile 75% (IQ3) | 87.2% | 84.6% |
| Interquartile Range (IQR) | 5.4% | 3.3% |
| Standard Deviation (Sample) | 5.1% | 4.1% |
| Standard Deviation (Population) | 5.1% | 4.0% |
Demographics Similar to Immigrants from Albania and Immigrants from China by In Labor Force | Age 45-54
In terms of in labor force | age 45-54, the demographic groups most similar to Immigrants from Albania are Assyrian/Chaldean/Syriac (83.2%, a difference of 0.0%), Immigrants from Chile (83.2%, a difference of 0.010%), Immigrants from Malaysia (83.2%, a difference of 0.010%), Immigrants from Italy (83.2%, a difference of 0.020%), and Immigrants from Afghanistan (83.2%, a difference of 0.020%). Similarly, the demographic groups most similar to Immigrants from China are Immigrants from Malaysia (83.2%, a difference of 0.010%), Immigrants from Europe (83.2%, a difference of 0.010%), Assyrian/Chaldean/Syriac (83.2%, a difference of 0.020%), Immigrants from Chile (83.2%, a difference of 0.020%), and Immigrants from Uruguay (83.2%, a difference of 0.020%).
| Demographics | Rating | Rank | In Labor Force | Age 45-54 |
| Immigrants | South America | 93.5 /100 | #105 | Exceptional 83.2% |
| Sri Lankans | 93.2 /100 | #106 | Exceptional 83.2% |
| Iranians | 92.9 /100 | #107 | Exceptional 83.2% |
| Slovaks | 92.8 /100 | #108 | Exceptional 83.2% |
| Ukrainians | 92.7 /100 | #109 | Exceptional 83.2% |
| Immigrants | Africa | 92.6 /100 | #110 | Exceptional 83.2% |
| Immigrants | Italy | 92.5 /100 | #111 | Exceptional 83.2% |
| Immigrants | Afghanistan | 92.4 /100 | #112 | Exceptional 83.2% |
| Immigrants | Albania | 91.8 /100 | #113 | Exceptional 83.2% |
| Assyrians/Chaldeans/Syriacs | 91.7 /100 | #114 | Exceptional 83.2% |
| Immigrants | Chile | 91.6 /100 | #115 | Exceptional 83.2% |
| Immigrants | Malaysia | 91.4 /100 | #116 | Exceptional 83.2% |
| Immigrants | China | 90.9 /100 | #117 | Exceptional 83.2% |
| Immigrants | Europe | 90.7 /100 | #118 | Exceptional 83.2% |
| Immigrants | Uruguay | 90.2 /100 | #119 | Exceptional 83.2% |
| Immigrants | Russia | 90.1 /100 | #120 | Exceptional 83.2% |
| Uruguayans | 89.4 /100 | #121 | Excellent 83.1% |
| Immigrants | Vietnam | 88.9 /100 | #122 | Excellent 83.1% |
| Tongans | 88.2 /100 | #123 | Excellent 83.1% |
| Bermudans | 88.0 /100 | #124 | Excellent 83.1% |
| Immigrants | Iran | 87.2 /100 | #125 | Excellent 83.1% |