Immigrants from Afghanistan vs Kenyan 6th Grade
COMPARE
Immigrants from Afghanistan
Kenyan
6th Grade
6th Grade Comparison
Immigrants from Afghanistan
Kenyans
96.2%
6TH GRADE
0.1/ 100
METRIC RATING
280th/ 347
METRIC RANK
97.1%
6TH GRADE
62.9/ 100
METRIC RATING
159th/ 347
METRIC RANK
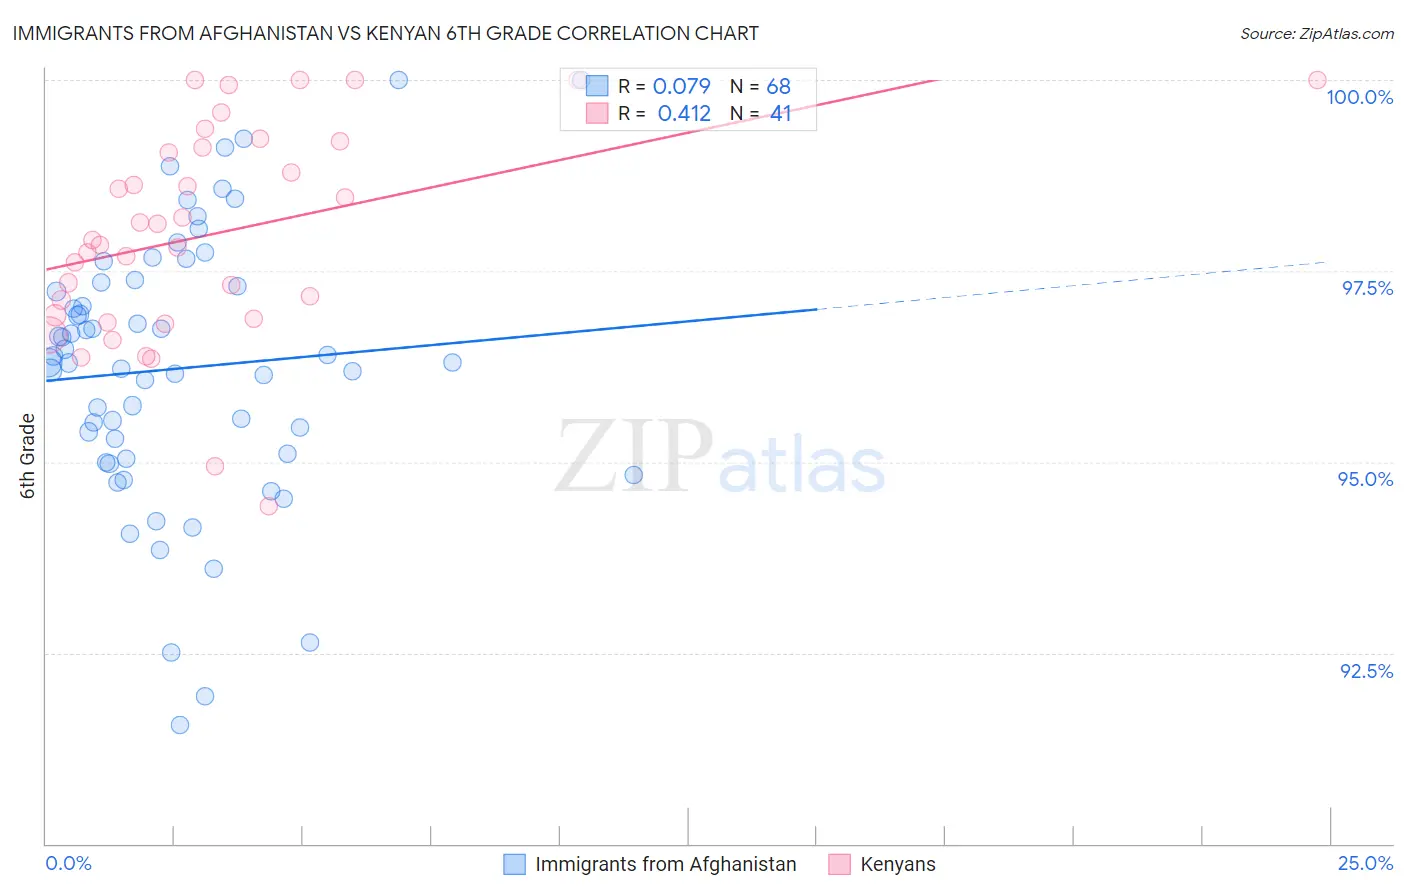
Immigrants from Afghanistan vs Kenyan 6th Grade Correlation Chart
The statistical analysis conducted on geographies consisting of 147,629,924 people shows a slight positive correlation between the proportion of Immigrants from Afghanistan and percentage of population with at least 6th grade education in the United States with a correlation coefficient (R) of 0.079 and weighted average of 96.2%. Similarly, the statistical analysis conducted on geographies consisting of 168,244,042 people shows a moderate positive correlation between the proportion of Kenyans and percentage of population with at least 6th grade education in the United States with a correlation coefficient (R) of 0.412 and weighted average of 97.1%, a difference of 0.90%.
6th Grade Correlation Summary
| Measurement | Immigrants from Afghanistan | Kenyan |
| Minimum | 91.6% | 94.4% |
| Maximum | 100.0% | 100.0% |
| Range | 8.4% | 5.6% |
| Mean | 96.2% | 98.0% |
| Median | 96.3% | 97.9% |
| Interquartile 25% (IQ1) | 95.1% | 96.9% |
| Interquartile 75% (IQ3) | 97.3% | 99.2% |
| Interquartile Range (IQR) | 2.2% | 2.3% |
| Standard Deviation (Sample) | 1.8% | 1.4% |
| Standard Deviation (Population) | 1.8% | 1.4% |
Similar Demographics by 6th Grade
Demographics Similar to Immigrants from Afghanistan by 6th Grade
In terms of 6th grade, the demographic groups most similar to Immigrants from Afghanistan are Immigrants from Peru (96.2%, a difference of 0.0%), Trinidadian and Tobagonian (96.2%, a difference of 0.0%), Houma (96.2%, a difference of 0.0%), Immigrants from Western Africa (96.3%, a difference of 0.020%), and Immigrants from Thailand (96.3%, a difference of 0.020%).
| Demographics | Rating | Rank | 6th Grade |
| Immigrants | Cameroon | 0.1 /100 | #273 | Tragic 96.3% |
| Immigrants | Philippines | 0.1 /100 | #274 | Tragic 96.3% |
| Immigrants | Ghana | 0.1 /100 | #275 | Tragic 96.3% |
| Yaqui | 0.1 /100 | #276 | Tragic 96.3% |
| Immigrants | Western Africa | 0.1 /100 | #277 | Tragic 96.3% |
| Immigrants | Thailand | 0.1 /100 | #278 | Tragic 96.3% |
| Immigrants | Peru | 0.1 /100 | #279 | Tragic 96.2% |
| Immigrants | Afghanistan | 0.1 /100 | #280 | Tragic 96.2% |
| Trinidadians and Tobagonians | 0.1 /100 | #281 | Tragic 96.2% |
| Houma | 0.1 /100 | #282 | Tragic 96.2% |
| Cubans | 0.1 /100 | #283 | Tragic 96.2% |
| Fijians | 0.1 /100 | #284 | Tragic 96.2% |
| Somalis | 0.1 /100 | #285 | Tragic 96.2% |
| Barbadians | 0.0 /100 | #286 | Tragic 96.2% |
| Immigrants | Trinidad and Tobago | 0.0 /100 | #287 | Tragic 96.2% |
Demographics Similar to Kenyans by 6th Grade
In terms of 6th grade, the demographic groups most similar to Kenyans are Immigrants from Iran (97.1%, a difference of 0.0%), Ugandan (97.1%, a difference of 0.0%), Immigrants from Belarus (97.1%, a difference of 0.010%), Marshallese (97.1%, a difference of 0.010%), and Immigrants from Russia (97.1%, a difference of 0.020%).
| Demographics | Rating | Rank | 6th Grade |
| Immigrants | Jordan | 73.0 /100 | #152 | Good 97.2% |
| Immigrants | Eastern Europe | 72.6 /100 | #153 | Good 97.2% |
| Soviet Union | 71.5 /100 | #154 | Good 97.2% |
| Ute | 71.1 /100 | #155 | Good 97.1% |
| Alsatians | 69.8 /100 | #156 | Good 97.1% |
| Immigrants | Russia | 67.6 /100 | #157 | Good 97.1% |
| Immigrants | Iran | 63.3 /100 | #158 | Good 97.1% |
| Kenyans | 62.9 /100 | #159 | Good 97.1% |
| Ugandans | 62.2 /100 | #160 | Good 97.1% |
| Immigrants | Belarus | 60.4 /100 | #161 | Good 97.1% |
| Marshallese | 60.2 /100 | #162 | Good 97.1% |
| Albanians | 57.8 /100 | #163 | Average 97.1% |
| Immigrants | Korea | 57.7 /100 | #164 | Average 97.1% |
| Immigrants | Poland | 56.2 /100 | #165 | Average 97.1% |
| Immigrants | Italy | 53.8 /100 | #166 | Average 97.1% |