Immigrants from Afghanistan vs Immigrants from Moldova 10th Grade
COMPARE
Immigrants from Afghanistan
Immigrants from Moldova
10th Grade
10th Grade Comparison
Immigrants from Afghanistan
Immigrants from Moldova
92.8%
10TH GRADE
1.4/ 100
METRIC RATING
247th/ 347
METRIC RANK
94.7%
10TH GRADE
98.9/ 100
METRIC RATING
89th/ 347
METRIC RANK
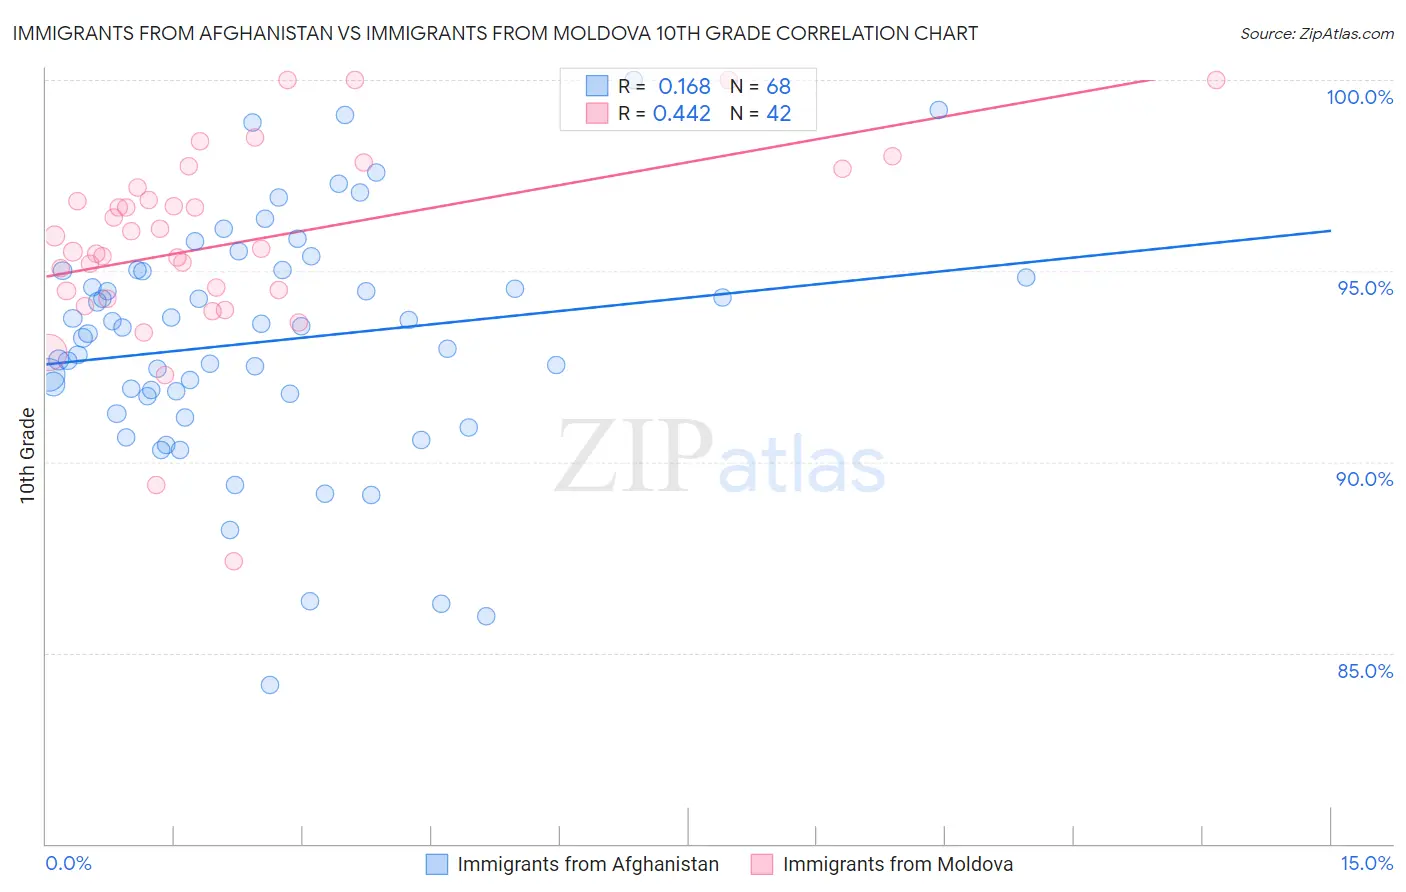
Immigrants from Afghanistan vs Immigrants from Moldova 10th Grade Correlation Chart
The statistical analysis conducted on geographies consisting of 147,629,924 people shows a poor positive correlation between the proportion of Immigrants from Afghanistan and percentage of population with at least 10th grade education in the United States with a correlation coefficient (R) of 0.168 and weighted average of 92.8%. Similarly, the statistical analysis conducted on geographies consisting of 124,396,843 people shows a moderate positive correlation between the proportion of Immigrants from Moldova and percentage of population with at least 10th grade education in the United States with a correlation coefficient (R) of 0.442 and weighted average of 94.7%, a difference of 2.0%.
10th Grade Correlation Summary
| Measurement | Immigrants from Afghanistan | Immigrants from Moldova |
| Minimum | 84.2% | 87.4% |
| Maximum | 100.0% | 100.0% |
| Range | 15.8% | 12.6% |
| Mean | 93.2% | 95.8% |
| Median | 93.4% | 95.7% |
| Interquartile 25% (IQ1) | 91.7% | 94.5% |
| Interquartile 75% (IQ3) | 95.0% | 97.2% |
| Interquartile Range (IQR) | 3.3% | 2.7% |
| Standard Deviation (Sample) | 3.1% | 2.6% |
| Standard Deviation (Population) | 3.1% | 2.5% |
Similar Demographics by 10th Grade
Demographics Similar to Immigrants from Afghanistan by 10th Grade
In terms of 10th grade, the demographic groups most similar to Immigrants from Afghanistan are Colombian (92.8%, a difference of 0.010%), Immigrants from Senegal (92.8%, a difference of 0.010%), Immigrants from Middle Africa (92.9%, a difference of 0.040%), Jamaican (92.8%, a difference of 0.040%), and Uruguayan (92.9%, a difference of 0.060%).
| Demographics | Rating | Rank | 10th Grade |
| Immigrants | Hong Kong | 4.2 /100 | #240 | Tragic 93.1% |
| Immigrants | Somalia | 2.7 /100 | #241 | Tragic 93.0% |
| Immigrants | Cameroon | 2.6 /100 | #242 | Tragic 93.0% |
| Senegalese | 2.4 /100 | #243 | Tragic 93.0% |
| Spanish Americans | 2.1 /100 | #244 | Tragic 92.9% |
| Uruguayans | 1.8 /100 | #245 | Tragic 92.9% |
| Immigrants | Middle Africa | 1.7 /100 | #246 | Tragic 92.9% |
| Immigrants | Afghanistan | 1.4 /100 | #247 | Tragic 92.8% |
| Colombians | 1.4 /100 | #248 | Tragic 92.8% |
| Immigrants | Senegal | 1.4 /100 | #249 | Tragic 92.8% |
| Jamaicans | 1.2 /100 | #250 | Tragic 92.8% |
| Immigrants | Thailand | 1.0 /100 | #251 | Tragic 92.8% |
| South Americans | 0.9 /100 | #252 | Tragic 92.8% |
| Ghanaians | 0.9 /100 | #253 | Tragic 92.8% |
| Armenians | 0.9 /100 | #254 | Tragic 92.7% |
Demographics Similar to Immigrants from Moldova by 10th Grade
In terms of 10th grade, the demographic groups most similar to Immigrants from Moldova are Immigrants from Japan (94.7%, a difference of 0.010%), South African (94.7%, a difference of 0.010%), Immigrants from Saudi Arabia (94.7%, a difference of 0.020%), White/Caucasian (94.7%, a difference of 0.020%), and Crow (94.7%, a difference of 0.030%).
| Demographics | Rating | Rank | 10th Grade |
| Swiss | 99.1 /100 | #82 | Exceptional 94.7% |
| Immigrants | Western Europe | 99.1 /100 | #83 | Exceptional 94.7% |
| Icelanders | 99.1 /100 | #84 | Exceptional 94.7% |
| Crow | 99.0 /100 | #85 | Exceptional 94.7% |
| Puget Sound Salish | 99.0 /100 | #86 | Exceptional 94.7% |
| Immigrants | Saudi Arabia | 99.0 /100 | #87 | Exceptional 94.7% |
| Immigrants | Japan | 99.0 /100 | #88 | Exceptional 94.7% |
| Immigrants | Moldova | 98.9 /100 | #89 | Exceptional 94.7% |
| South Africans | 98.8 /100 | #90 | Exceptional 94.7% |
| Whites/Caucasians | 98.8 /100 | #91 | Exceptional 94.7% |
| Yugoslavians | 98.4 /100 | #92 | Exceptional 94.6% |
| Soviet Union | 98.3 /100 | #93 | Exceptional 94.6% |
| Immigrants | Germany | 98.3 /100 | #94 | Exceptional 94.6% |
| Menominee | 98.3 /100 | #95 | Exceptional 94.6% |
| Immigrants | Switzerland | 98.3 /100 | #96 | Exceptional 94.6% |