Hungarian vs Ethiopian 1st Grade
COMPARE
Hungarian
Ethiopian
1st Grade
1st Grade Comparison
Hungarians
Ethiopians
98.4%
1ST GRADE
99.9/ 100
METRIC RATING
46th/ 347
METRIC RANK
97.6%
1ST GRADE
0.9/ 100
METRIC RATING
250th/ 347
METRIC RANK
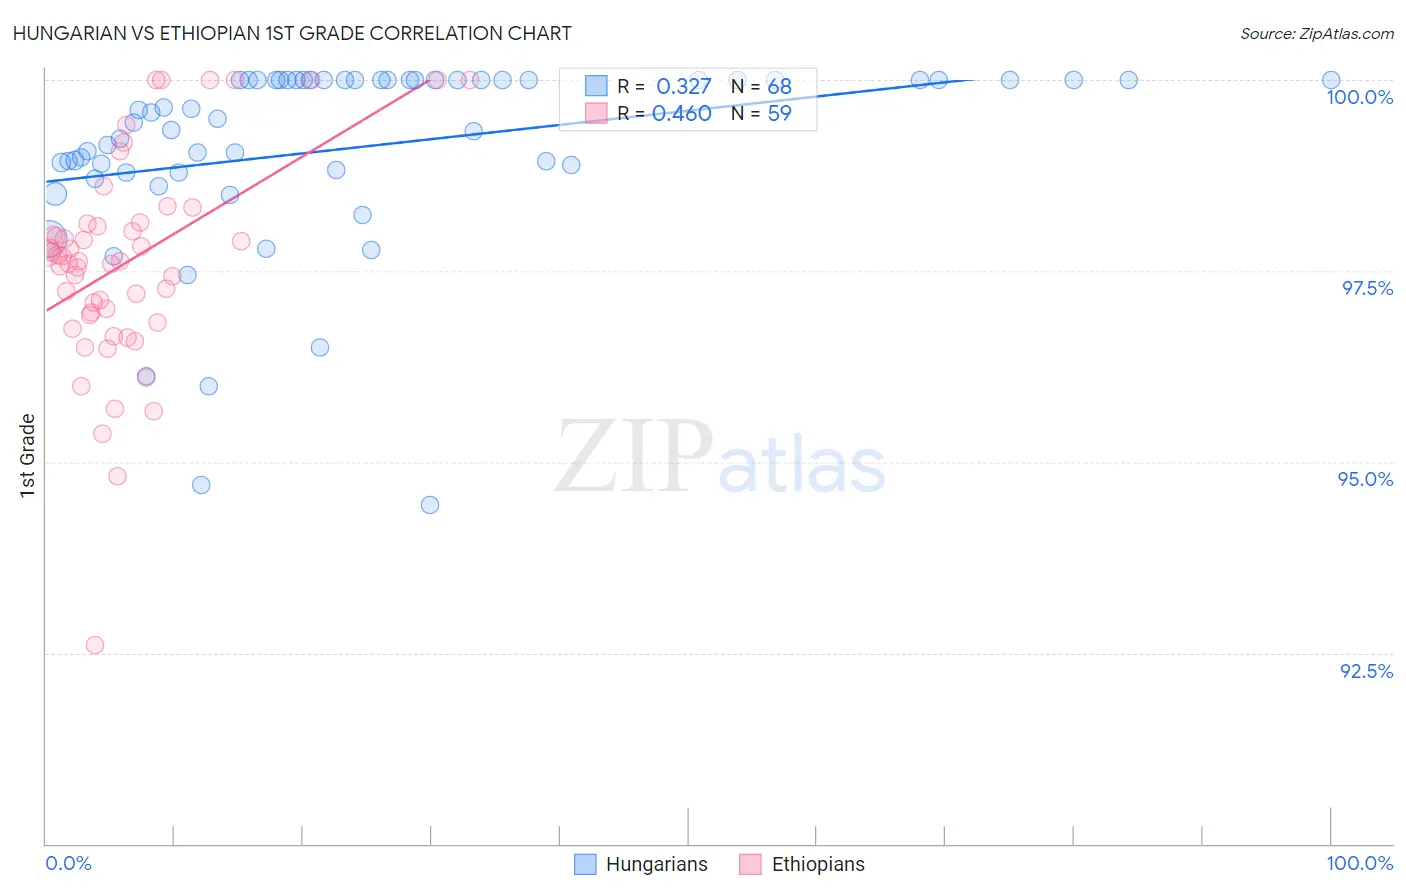
Hungarian vs Ethiopian 1st Grade Correlation Chart
The statistical analysis conducted on geographies consisting of 486,239,439 people shows a mild positive correlation between the proportion of Hungarians and percentage of population with at least 1st grade education in the United States with a correlation coefficient (R) of 0.327 and weighted average of 98.4%. Similarly, the statistical analysis conducted on geographies consisting of 223,220,814 people shows a moderate positive correlation between the proportion of Ethiopians and percentage of population with at least 1st grade education in the United States with a correlation coefficient (R) of 0.460 and weighted average of 97.6%, a difference of 0.88%.
1st Grade Correlation Summary
| Measurement | Hungarian | Ethiopian |
| Minimum | 94.4% | 92.6% |
| Maximum | 100.0% | 100.0% |
| Range | 5.6% | 7.4% |
| Mean | 99.1% | 97.6% |
| Median | 99.5% | 97.6% |
| Interquartile 25% (IQ1) | 98.8% | 96.9% |
| Interquartile 75% (IQ3) | 100.0% | 98.1% |
| Interquartile Range (IQR) | 1.2% | 1.2% |
| Standard Deviation (Sample) | 1.2% | 1.4% |
| Standard Deviation (Population) | 1.2% | 1.4% |
Similar Demographics by 1st Grade
Demographics Similar to Hungarians by 1st Grade
In terms of 1st grade, the demographic groups most similar to Hungarians are Lumbee (98.5%, a difference of 0.020%), Northern European (98.5%, a difference of 0.020%), Belgian (98.4%, a difference of 0.020%), Ottawa (98.4%, a difference of 0.020%), and Czechoslovakian (98.4%, a difference of 0.020%).
| Demographics | Rating | Rank | 1st Grade |
| Latvians | 99.9 /100 | #39 | Exceptional 98.5% |
| Luxembourgers | 99.9 /100 | #40 | Exceptional 98.5% |
| Eastern Europeans | 99.9 /100 | #41 | Exceptional 98.5% |
| Native Hawaiians | 99.9 /100 | #42 | Exceptional 98.5% |
| Lumbee | 99.9 /100 | #43 | Exceptional 98.5% |
| Northern Europeans | 99.9 /100 | #44 | Exceptional 98.5% |
| Belgians | 99.9 /100 | #45 | Exceptional 98.4% |
| Hungarians | 99.9 /100 | #46 | Exceptional 98.4% |
| Ottawa | 99.8 /100 | #47 | Exceptional 98.4% |
| Czechoslovakians | 99.8 /100 | #48 | Exceptional 98.4% |
| Celtics | 99.8 /100 | #49 | Exceptional 98.4% |
| Whites/Caucasians | 99.8 /100 | #50 | Exceptional 98.4% |
| Estonians | 99.8 /100 | #51 | Exceptional 98.4% |
| Pueblo | 99.8 /100 | #52 | Exceptional 98.4% |
| Kiowa | 99.8 /100 | #53 | Exceptional 98.4% |
Demographics Similar to Ethiopians by 1st Grade
In terms of 1st grade, the demographic groups most similar to Ethiopians are Immigrants from Iraq (97.6%, a difference of 0.0%), South American (97.6%, a difference of 0.010%), Immigrants from Eastern Africa (97.6%, a difference of 0.010%), Peruvian (97.6%, a difference of 0.010%), and Immigrants from Middle Africa (97.6%, a difference of 0.010%).
| Demographics | Rating | Rank | 1st Grade |
| Bolivians | 1.2 /100 | #243 | Tragic 97.6% |
| Asians | 1.1 /100 | #244 | Tragic 97.6% |
| South Americans | 1.1 /100 | #245 | Tragic 97.6% |
| Immigrants | Eastern Africa | 1.0 /100 | #246 | Tragic 97.6% |
| Peruvians | 1.0 /100 | #247 | Tragic 97.6% |
| Immigrants | Middle Africa | 1.0 /100 | #248 | Tragic 97.6% |
| Immigrants | Senegal | 1.0 /100 | #249 | Tragic 97.6% |
| Ethiopians | 0.9 /100 | #250 | Tragic 97.6% |
| Immigrants | Iraq | 0.9 /100 | #251 | Tragic 97.6% |
| Immigrants | Africa | 0.9 /100 | #252 | Tragic 97.6% |
| Immigrants | Congo | 0.7 /100 | #253 | Tragic 97.5% |
| Immigrants | Asia | 0.7 /100 | #254 | Tragic 97.5% |
| Immigrants | Colombia | 0.6 /100 | #255 | Tragic 97.5% |
| Jamaicans | 0.6 /100 | #256 | Tragic 97.5% |
| Yaqui | 0.6 /100 | #257 | Tragic 97.5% |