Hungarian vs Immigrants from Trinidad and Tobago 1st Grade

COMPARE

Hungarian
Race
Ancestry
AfghanAfricanAlaska NativeAlaskan AthabascanAlbanianAleutAlsatianAmericanApacheArabArapahoArgentineanArmenianAssyrian/Chaldean/SyriacAustralianAustrianBahamianBangladeshiBarbadianBasqueBelgianBelizeanBermudanBhutaneseBlackfeetBolivianBrazilianBritishBritish West IndianBulgarianBurmeseCajunCambodianCanadianCape VerdeanCarpatho RusynCelticCentral AmericanCentral American IndianCherokeeCheyenneChickasawChileanChineseChippewaChoctawColombianColvilleComancheCosta RicanCreeCreekCroatianCrowCubanCypriotCzechCzechoslovakianDanishDelawareDominicanDutchDutch West IndianEastern EuropeanEcuadorianEgyptianEnglishEstonianEthiopianEuropeanFijianFilipinoFinnishFrenchFrench American IndianFrench CanadianGermanGerman RussianGhanaianGreekGuamanian/ChamorroGuatemalanGuyaneseHaitianHmongHonduranHopiHoumaHungarianIcelanderIndian (Asian)IndonesianInupiatIranianIraqiIrishIroquoisIsraeliItalianJamaicanJapaneseJordanianKenyanKiowaKoreanLaotianLatvianLebaneseLiberianLithuanianLumbeeLuxembourgerMacedonianMalaysianMalteseMarshalleseMenomineeMexicanMexican American IndianMongolianMoroccanNative HawaiianNavajoNepaleseNew ZealanderNicaraguanNigerianNorthern EuropeanNorwegianOkinawanOsageOttawaPaiutePakistaniPalestinianPanamanianParaguayanPennsylvania GermanPeruvianPimaPolishPortuguesePotawatomiPuebloPuerto RicanPuget Sound SalishRomanianRussianSalvadoranSamoanScandinavianScotch-IrishScottishSeminoleSenegaleseSerbianShoshoneSierra LeoneanSiouxSlavicSlovakSloveneSomaliSouth AfricanSouth AmericanSouth American IndianSoviet UnionSpaniardSpanishSpanish AmericanSpanish American IndianSri LankanSubsaharan AfricanSudaneseSwedishSwissSyrianTaiwaneseThaiTlingit-HaidaTohono O'OdhamTonganTrinidadian and TobagonianTsimshianTurkishU.S. Virgin IslanderUgandanUkrainianUruguayanUteVenezuelanVietnameseWelshWest IndianYakamaYaquiYugoslavianYumanYup'ikZimbabwean
Immigration
NonimmigrantsImmigrantsAfghanistanAfricaAlbaniaArgentinaArmeniaAsiaAustraliaAustriaBahamasBangladeshBarbadosBelarusBelgiumBelizeBoliviaBosnia and HerzegovinaBrazilBulgariaBurma/MyanmarCabo VerdeCambodiaCameroonCanadaCaribbeanCentral AmericaChileChinaColombiaCongoCosta RicaCroatiaCubaCzechoslovakiaDenmarkDominicaDominican RepublicEastern AfricaEastern AsiaEastern EuropeEcuadorEgyptEl SalvadorEnglandEritreaEthiopiaEuropeFijiFranceGermanyGhanaGreeceGrenadaGuatemalaGuyanaHaitiHondurasHong KongHungaryIndiaIndonesiaIranIraqIrelandIsraelItalyJamaicaJapanJordanKazakhstanKenyaKoreaKuwaitLaosLatin AmericaLatviaLebanonLiberiaLithuaniaMalaysiaMexicoMicronesiaMiddle AfricaMoldovaMoroccoNepalNetherlandsNicaraguaNigeriaNorth AmericaNorth MacedoniaNorthern AfricaNorthern EuropeNorwayOceaniaPakistanPanamaPeruPhilippinesPolandPortugalRomaniaRussiaSaudi ArabiaScotlandSenegalSerbiaSierra LeoneSingaporeSomaliaSouth AfricaSouth AmericaSouth Central AsiaSouth Eastern AsiaSouthern EuropeSpainSri LankaSt. Vincent and the GrenadinesSudanSwedenSwitzerlandSyriaTaiwanThailandTurkeyUgandaUkraineUruguayUzbekistanVenezuelaVietnamWest IndiesWestern AfricaWestern AsiaWestern EuropeYemenZaireZimbabweAzores
Immigrants from Trinidad and Tobago
Race
Ancestry
AfghanAfricanAlaska NativeAlaskan AthabascanAlbanianAleutAlsatianAmericanApacheArabArapahoArgentineanArmenianAssyrian/Chaldean/SyriacAustralianAustrianBahamianBangladeshiBarbadianBasqueBelgianBelizeanBermudanBhutaneseBlackfeetBolivianBrazilianBritishBritish West IndianBulgarianBurmeseCajunCambodianCanadianCape VerdeanCarpatho RusynCelticCentral AmericanCentral American IndianCherokeeCheyenneChickasawChileanChineseChippewaChoctawColombianColvilleComancheCosta RicanCreeCreekCroatianCrowCubanCypriotCzechCzechoslovakianDanishDelawareDominicanDutchDutch West IndianEastern EuropeanEcuadorianEgyptianEnglishEstonianEthiopianEuropeanFijianFilipinoFinnishFrenchFrench American IndianFrench CanadianGermanGerman RussianGhanaianGreekGuamanian/ChamorroGuatemalanGuyaneseHaitianHmongHonduranHopiHoumaIcelanderIndian (Asian)IndonesianInupiatIranianIraqiIrishIroquoisIsraeliItalianJamaicanJapaneseJordanianKenyanKiowaKoreanLaotianLatvianLebaneseLiberianLithuanianLumbeeLuxembourgerMacedonianMalaysianMalteseMarshalleseMenomineeMexicanMexican American IndianMongolianMoroccanNative HawaiianNavajoNepaleseNew ZealanderNicaraguanNigerianNorthern EuropeanNorwegianOkinawanOsageOttawaPaiutePakistaniPalestinianPanamanianParaguayanPennsylvania GermanPeruvianPimaPolishPortuguesePotawatomiPuebloPuerto RicanPuget Sound SalishRomanianRussianSalvadoranSamoanScandinavianScotch-IrishScottishSeminoleSenegaleseSerbianShoshoneSierra LeoneanSiouxSlavicSlovakSloveneSomaliSouth AfricanSouth AmericanSouth American IndianSoviet UnionSpaniardSpanishSpanish AmericanSpanish American IndianSri LankanSubsaharan AfricanSudaneseSwedishSwissSyrianTaiwaneseThaiTlingit-HaidaTohono O'OdhamTonganTrinidadian and TobagonianTsimshianTurkishU.S. Virgin IslanderUgandanUkrainianUruguayanUteVenezuelanVietnameseWelshWest IndianYakamaYaquiYugoslavianYumanYup'ikZimbabwean
Immigration
NonimmigrantsImmigrantsAfghanistanAfricaAlbaniaArgentinaArmeniaAsiaAustraliaAustriaBahamasBangladeshBarbadosBelarusBelgiumBelizeBoliviaBosnia and HerzegovinaBrazilBulgariaBurma/MyanmarCabo VerdeCambodiaCameroonCanadaCaribbeanCentral AmericaChileChinaColombiaCongoCosta RicaCroatiaCubaCzechoslovakiaDenmarkDominicaDominican RepublicEastern AfricaEastern AsiaEastern EuropeEcuadorEgyptEl SalvadorEnglandEritreaEthiopiaEuropeFijiFranceGermanyGhanaGreeceGrenadaGuatemalaGuyanaHaitiHondurasHong KongHungaryIndiaIndonesiaIranIraqIrelandIsraelItalyJamaicaJapanJordanKazakhstanKenyaKoreaKuwaitLaosLatin AmericaLatviaLebanonLiberiaLithuaniaMalaysiaMexicoMicronesiaMiddle AfricaMoldovaMoroccoNepalNetherlandsNicaraguaNigeriaNorth AmericaNorth MacedoniaNorthern AfricaNorthern EuropeNorwayOceaniaPakistanPanamaPeruPhilippinesPolandPortugalRomaniaRussiaSaudi ArabiaScotlandSenegalSerbiaSierra LeoneSingaporeSomaliaSouth AfricaSouth AmericaSouth Central AsiaSouth Eastern AsiaSouthern EuropeSpainSri LankaSt. Vincent and the GrenadinesSudanSwedenSwitzerlandSyriaTaiwanThailandTrinidad and TobagoTurkeyUgandaUkraineUruguayUzbekistanVenezuelaVietnamWest IndiesWestern AfricaWestern AsiaWestern EuropeYemenZaireZimbabweAzores
1st Grade
Income
Poverty
Unemployment
Labor Participation
Family Structure
Vehicle Availability
Education Level
Disability

1st Grade Comparison

Hungarians

Immigrants from Trinidad and Tobago

Exceptional
Tragic
98.4%
1ST GRADE
99.9/ 100
METRIC RATING
46th/ 347
METRIC RANK
97.3%
1ST GRADE
0.0/ 100
METRIC RATING
284th/ 347
METRIC RANK

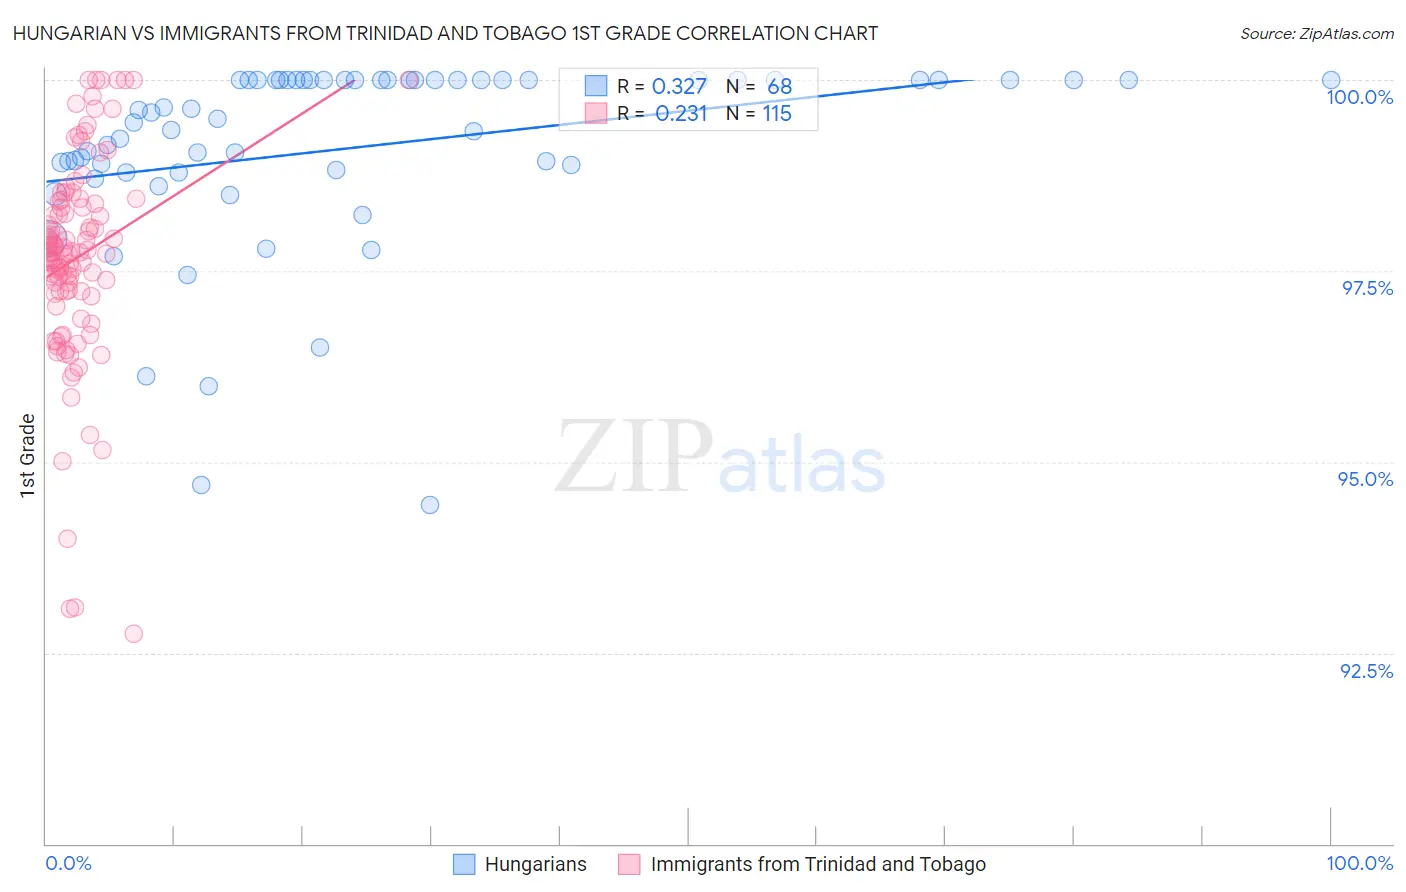
Hungarian vs Immigrants from Trinidad and Tobago 1st Grade Correlation Chart

The statistical analysis conducted on geographies consisting of 486,239,439 people shows a mild positive correlation between the proportion of Hungarians and percentage of population with at least 1st grade education in the United States with a correlation coefficient (R) of 0.327 and weighted average of 98.4%. Similarly, the statistical analysis conducted on geographies consisting of 223,545,304 people shows a weak positive correlation between the proportion of Immigrants from Trinidad and Tobago and percentage of population with at least 1st grade education in the United States with a correlation coefficient (R) of 0.231 and weighted average of 97.3%, a difference of 1.2%.
Hungarian vs Immigrants from Trinidad and Tobago 1st Grade

1st Grade Correlation Summary

MeasurementHungarianImmigrants from Trinidad and Tobago
Minimum94.4%92.8%
Maximum100.0%100.0%
Range5.6%7.2%
Mean99.1%97.7%
Median99.5%97.7%
Interquartile 25% (IQ1)98.8%97.2%
Interquartile 75% (IQ3)100.0%98.4%
Interquartile Range (IQR)1.2%1.1%
Standard Deviation (Sample)1.2%1.4%
Standard Deviation (Population)1.2%1.4%

Similar Demographics by 1st Grade

Demographics Similar to Hungarians by 1st Grade

In terms of 1st grade, the demographic groups most similar to Hungarians are Lumbee (98.5%, a difference of 0.020%), Northern European (98.5%, a difference of 0.020%), Belgian (98.4%, a difference of 0.020%), Ottawa (98.4%, a difference of 0.020%), and Czechoslovakian (98.4%, a difference of 0.020%).
DemographicsRating | Rank1st Grade
Latvians
99.9
/100
|
#39
Exceptional
98.5%
Luxembourgers
99.9
/100
|
#40
Exceptional
98.5%
Eastern Europeans
99.9
/100
|
#41
Exceptional
98.5%
Native Hawaiians
99.9
/100
|
#42
Exceptional
98.5%
Lumbee
99.9
/100
|
#43
Exceptional
98.5%
Northern Europeans
99.9
/100
|
#44
Exceptional
98.5%
Belgians
99.9
/100
|
#45
Exceptional
98.4%
Hungarians
99.9
/100
|
#46
Exceptional
98.4%
Ottawa
99.8
/100
|
#47
Exceptional
98.4%
Czechoslovakians
99.8
/100
|
#48
Exceptional
98.4%
Celtics
99.8
/100
|
#49
Exceptional
98.4%
Whites/Caucasians
99.8
/100
|
#50
Exceptional
98.4%
Estonians
99.8
/100
|
#51
Exceptional
98.4%
Pueblo
99.8
/100
|
#52
Exceptional
98.4%
Kiowa
99.8
/100
|
#53
Exceptional
98.4%

Demographics Similar to Immigrants from Trinidad and Tobago by 1st Grade

In terms of 1st grade, the demographic groups most similar to Immigrants from Trinidad and Tobago are Immigrants from Portugal (97.3%, a difference of 0.0%), Immigrants from West Indies (97.3%, a difference of 0.010%), Immigrants from Barbados (97.3%, a difference of 0.020%), Immigrants from Hong Kong (97.3%, a difference of 0.030%), and Immigrants from Thailand (97.3%, a difference of 0.030%).
DemographicsRating | Rank1st Grade
Immigrants | Western Africa
0.1
/100
|
#277
Tragic
97.4%
Immigrants | Uzbekistan
0.1
/100
|
#278
Tragic
97.4%
Immigrants | Ghana
0.1
/100
|
#279
Tragic
97.4%
Afghans
0.1
/100
|
#280
Tragic
97.4%
Trinidadians and Tobagonians
0.1
/100
|
#281
Tragic
97.3%
Barbadians
0.1
/100
|
#282
Tragic
97.3%
Immigrants | West Indies
0.0
/100
|
#283
Tragic
97.3%
Immigrants | Trinidad and Tobago
0.0
/100
|
#284
Tragic
97.3%
Immigrants | Portugal
0.0
/100
|
#285
Tragic
97.3%
Immigrants | Barbados
0.0
/100
|
#286
Tragic
97.3%
Immigrants | Hong Kong
0.0
/100
|
#287
Tragic
97.3%
Immigrants | Thailand
0.0
/100
|
#288
Tragic
97.3%
Immigrants | Afghanistan
0.0
/100
|
#289
Tragic
97.3%
Immigrants | St. Vincent and the Grenadines
0.0
/100
|
#290
Tragic
97.3%
Houma
0.0
/100
|
#291
Tragic
97.2%