Bulgarian vs Hawaiian 3rd Grade
COMPARE
Bulgarian
Hawaiian
3rd Grade
3rd Grade Comparison
Bulgarians
Hawaiians
98.3%
3RD GRADE
99.8/ 100
METRIC RATING
54th/ 347
METRIC RANK
97.7%
3RD GRADE
25.7/ 100
METRIC RATING
197th/ 347
METRIC RANK
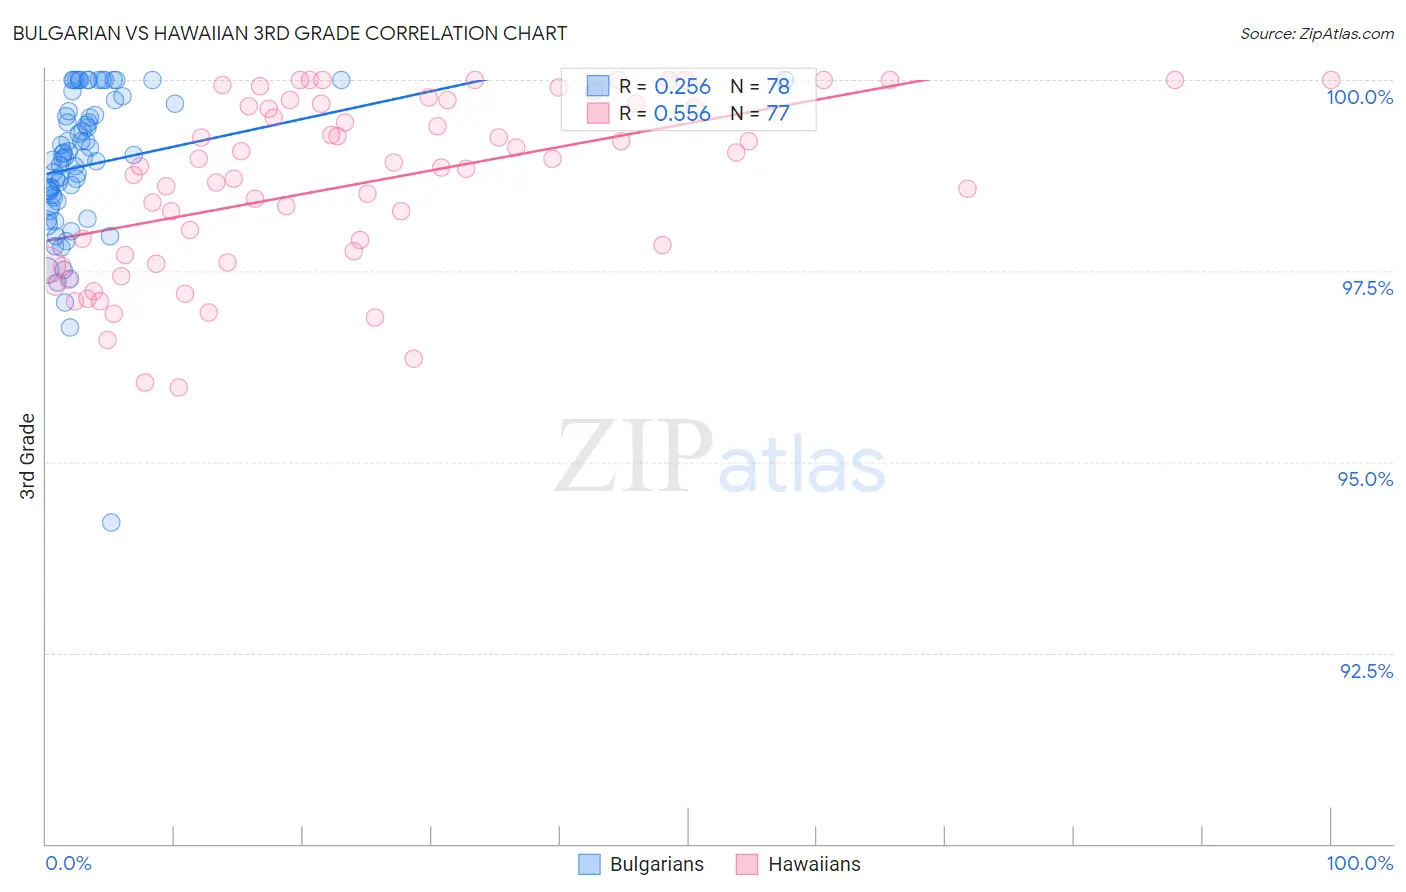
Bulgarian vs Hawaiian 3rd Grade Correlation Chart
The statistical analysis conducted on geographies consisting of 205,633,223 people shows a weak positive correlation between the proportion of Bulgarians and percentage of population with at least 3rd grade education in the United States with a correlation coefficient (R) of 0.256 and weighted average of 98.3%. Similarly, the statistical analysis conducted on geographies consisting of 327,621,279 people shows a substantial positive correlation between the proportion of Hawaiians and percentage of population with at least 3rd grade education in the United States with a correlation coefficient (R) of 0.556 and weighted average of 97.7%, a difference of 0.60%.
3rd Grade Correlation Summary
| Measurement | Bulgarian | Hawaiian |
| Minimum | 94.2% | 96.0% |
| Maximum | 100.0% | 100.0% |
| Range | 5.8% | 4.0% |
| Mean | 98.9% | 98.7% |
| Median | 99.0% | 98.9% |
| Interquartile 25% (IQ1) | 98.4% | 97.7% |
| Interquartile 75% (IQ3) | 99.6% | 99.7% |
| Interquartile Range (IQR) | 1.2% | 2.0% |
| Standard Deviation (Sample) | 0.98% | 1.1% |
| Standard Deviation (Population) | 0.97% | 1.1% |
Similar Demographics by 3rd Grade
Demographics Similar to Bulgarians by 3rd Grade
In terms of 3rd grade, the demographic groups most similar to Bulgarians are American (98.3%, a difference of 0.0%), Austrian (98.3%, a difference of 0.0%), White/Caucasian (98.3%, a difference of 0.010%), Immigrants from Scotland (98.3%, a difference of 0.010%), and Slavic (98.3%, a difference of 0.010%).
| Demographics | Rating | Rank | 3rd Grade |
| Czechoslovakians | 99.8 /100 | #47 | Exceptional 98.3% |
| Lumbee | 99.8 /100 | #48 | Exceptional 98.3% |
| Estonians | 99.8 /100 | #49 | Exceptional 98.3% |
| Celtics | 99.8 /100 | #50 | Exceptional 98.3% |
| Australians | 99.8 /100 | #51 | Exceptional 98.3% |
| Whites/Caucasians | 99.8 /100 | #52 | Exceptional 98.3% |
| Immigrants | Scotland | 99.8 /100 | #53 | Exceptional 98.3% |
| Bulgarians | 99.8 /100 | #54 | Exceptional 98.3% |
| Americans | 99.8 /100 | #55 | Exceptional 98.3% |
| Austrians | 99.8 /100 | #56 | Exceptional 98.3% |
| Slavs | 99.7 /100 | #57 | Exceptional 98.3% |
| Greeks | 99.7 /100 | #58 | Exceptional 98.3% |
| Maltese | 99.7 /100 | #59 | Exceptional 98.3% |
| Creek | 99.7 /100 | #60 | Exceptional 98.2% |
| Pueblo | 99.7 /100 | #61 | Exceptional 98.2% |
Demographics Similar to Hawaiians by 3rd Grade
In terms of 3rd grade, the demographic groups most similar to Hawaiians are Immigrants from Egypt (97.7%, a difference of 0.0%), Paraguayan (97.7%, a difference of 0.0%), Mongolian (97.7%, a difference of 0.010%), Immigrants from Kenya (97.7%, a difference of 0.010%), and Immigrants from Uganda (97.7%, a difference of 0.010%).
| Demographics | Rating | Rank | 3rd Grade |
| Panamanians | 31.5 /100 | #190 | Fair 97.7% |
| Blacks/African Americans | 29.6 /100 | #191 | Fair 97.7% |
| Mongolians | 29.1 /100 | #192 | Fair 97.7% |
| Immigrants | Kenya | 28.2 /100 | #193 | Fair 97.7% |
| Immigrants | Uganda | 27.4 /100 | #194 | Fair 97.7% |
| Immigrants | Egypt | 26.8 /100 | #195 | Fair 97.7% |
| Paraguayans | 26.2 /100 | #196 | Fair 97.7% |
| Hawaiians | 25.7 /100 | #197 | Fair 97.7% |
| Guamanians/Chamorros | 23.6 /100 | #198 | Fair 97.7% |
| Immigrants | Ukraine | 22.7 /100 | #199 | Fair 97.7% |
| Immigrants | Albania | 22.6 /100 | #200 | Fair 97.7% |
| Immigrants | Lebanon | 21.7 /100 | #201 | Fair 97.7% |
| Immigrants | Southern Europe | 17.7 /100 | #202 | Poor 97.6% |
| Paiute | 16.7 /100 | #203 | Poor 97.6% |
| Immigrants | Chile | 16.5 /100 | #204 | Poor 97.6% |