Houma vs Lithuanian Nursery School
COMPARE
Houma
Lithuanian
Nursery School
Nursery School Comparison
Houma
Lithuanians
97.3%
NURSERY SCHOOL
0.0/ 100
METRIC RATING
292nd/ 347
METRIC RANK
98.6%
NURSERY SCHOOL
100.0/ 100
METRIC RATING
22nd/ 347
METRIC RANK
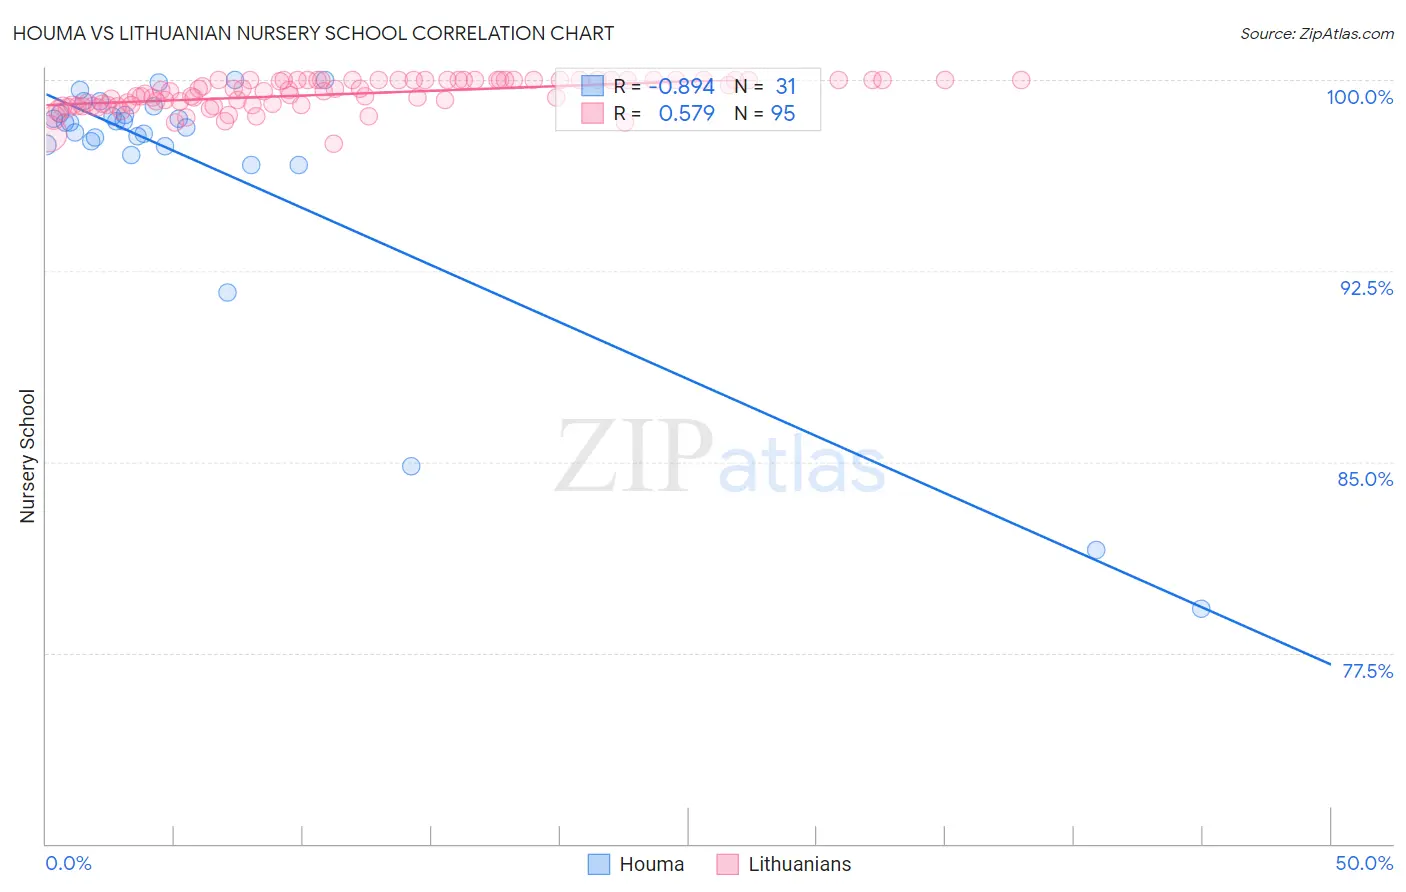
Houma vs Lithuanian Nursery School Correlation Chart
The statistical analysis conducted on geographies consisting of 36,795,916 people shows a very strong negative correlation between the proportion of Houma and percentage of population with at least nursery school education in the United States with a correlation coefficient (R) of -0.894 and weighted average of 97.3%. Similarly, the statistical analysis conducted on geographies consisting of 421,946,231 people shows a substantial positive correlation between the proportion of Lithuanians and percentage of population with at least nursery school education in the United States with a correlation coefficient (R) of 0.579 and weighted average of 98.6%, a difference of 1.4%.
Nursery School Correlation Summary
| Measurement | Houma | Lithuanian |
| Minimum | 79.2% | 97.5% |
| Maximum | 100.0% | 100.0% |
| Range | 20.8% | 2.5% |
| Mean | 96.5% | 99.4% |
| Median | 98.3% | 99.6% |
| Interquartile 25% (IQ1) | 97.4% | 99.0% |
| Interquartile 75% (IQ3) | 98.7% | 100.0% |
| Interquartile Range (IQR) | 1.3% | 0.98% |
| Standard Deviation (Sample) | 5.2% | 0.57% |
| Standard Deviation (Population) | 5.1% | 0.57% |
Similar Demographics by Nursery School
Demographics Similar to Houma by Nursery School
In terms of nursery school, the demographic groups most similar to Houma are Malaysian (97.3%, a difference of 0.010%), British West Indian (97.3%, a difference of 0.020%), Immigrants from Grenada (97.3%, a difference of 0.020%), Immigrants (97.2%, a difference of 0.030%), and Immigrants from Eritrea (97.2%, a difference of 0.040%).
| Demographics | Rating | Rank | Nursery School |
| Immigrants | Barbados | 0.0 /100 | #285 | Tragic 97.4% |
| Immigrants | Portugal | 0.0 /100 | #286 | Tragic 97.4% |
| Immigrants | Hong Kong | 0.0 /100 | #287 | Tragic 97.4% |
| Immigrants | Thailand | 0.0 /100 | #288 | Tragic 97.3% |
| Immigrants | St. Vincent and the Grenadines | 0.0 /100 | #289 | Tragic 97.3% |
| Immigrants | Afghanistan | 0.0 /100 | #290 | Tragic 97.3% |
| British West Indians | 0.0 /100 | #291 | Tragic 97.3% |
| Houma | 0.0 /100 | #292 | Tragic 97.3% |
| Malaysians | 0.0 /100 | #293 | Tragic 97.3% |
| Immigrants | Grenada | 0.0 /100 | #294 | Tragic 97.3% |
| Immigrants | Immigrants | 0.0 /100 | #295 | Tragic 97.2% |
| Immigrants | Eritrea | 0.0 /100 | #296 | Tragic 97.2% |
| Immigrants | Cuba | 0.0 /100 | #297 | Tragic 97.2% |
| Central American Indians | 0.0 /100 | #298 | Tragic 97.2% |
| Immigrants | Dominica | 0.0 /100 | #299 | Tragic 97.2% |
Demographics Similar to Lithuanians by Nursery School
In terms of nursery school, the demographic groups most similar to Lithuanians are Pennsylvania German (98.6%, a difference of 0.0%), Finnish (98.6%, a difference of 0.0%), Polish (98.6%, a difference of 0.0%), Danish (98.6%, a difference of 0.0%), and Scotch-Irish (98.6%, a difference of 0.0%).
| Demographics | Rating | Rank | Nursery School |
| Swedes | 100.0 /100 | #15 | Exceptional 98.7% |
| Scottish | 100.0 /100 | #16 | Exceptional 98.7% |
| Aleuts | 100.0 /100 | #17 | Exceptional 98.7% |
| Dutch | 100.0 /100 | #18 | Exceptional 98.7% |
| Irish | 100.0 /100 | #19 | Exceptional 98.6% |
| Pennsylvania Germans | 100.0 /100 | #20 | Exceptional 98.6% |
| Finns | 100.0 /100 | #21 | Exceptional 98.6% |
| Lithuanians | 100.0 /100 | #22 | Exceptional 98.6% |
| Poles | 100.0 /100 | #23 | Exceptional 98.6% |
| Danes | 100.0 /100 | #24 | Exceptional 98.6% |
| Scotch-Irish | 100.0 /100 | #25 | Exceptional 98.6% |
| Sioux | 100.0 /100 | #26 | Exceptional 98.6% |
| Arapaho | 100.0 /100 | #27 | Exceptional 98.6% |
| Croatians | 100.0 /100 | #28 | Exceptional 98.6% |
| French | 100.0 /100 | #29 | Exceptional 98.6% |