Hopi vs South African Bachelor's Degree
COMPARE
Hopi
South African
Bachelor's Degree
Bachelor's Degree Comparison
Hopi
South Africans
25.3%
BACHELOR'S DEGREE
0.0/ 100
METRIC RATING
339th/ 347
METRIC RANK
43.6%
BACHELOR'S DEGREE
99.8/ 100
METRIC RATING
61st/ 347
METRIC RANK
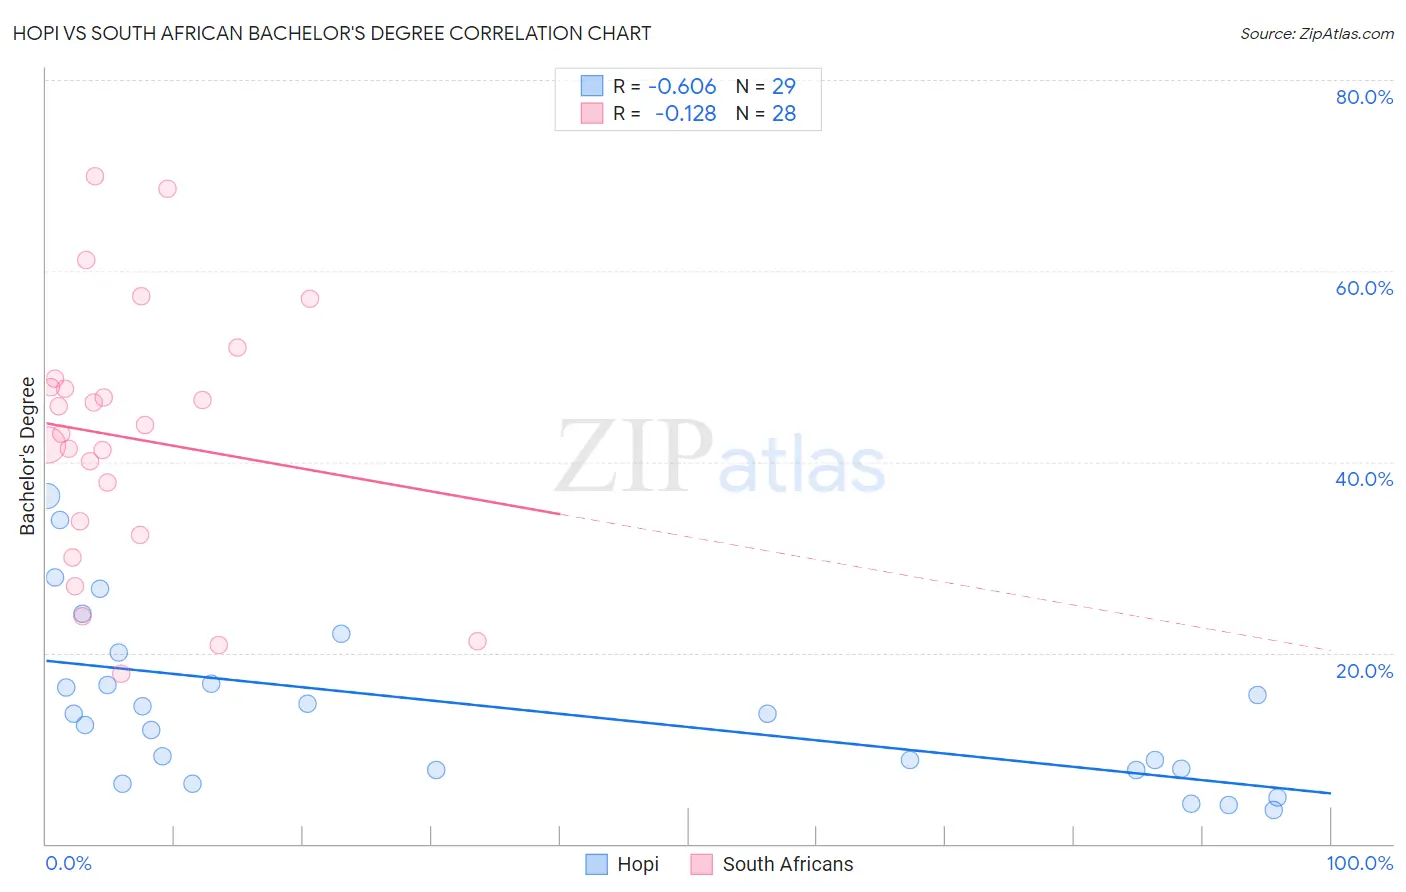
Hopi vs South African Bachelor's Degree Correlation Chart
The statistical analysis conducted on geographies consisting of 74,738,179 people shows a significant negative correlation between the proportion of Hopi and percentage of population with at least bachelor's degree education in the United States with a correlation coefficient (R) of -0.606 and weighted average of 25.3%. Similarly, the statistical analysis conducted on geographies consisting of 182,590,093 people shows a poor negative correlation between the proportion of South Africans and percentage of population with at least bachelor's degree education in the United States with a correlation coefficient (R) of -0.128 and weighted average of 43.6%, a difference of 72.1%.
Bachelor's Degree Correlation Summary
| Measurement | Hopi | South African |
| Minimum | 3.5% | 17.8% |
| Maximum | 36.4% | 69.9% |
| Range | 32.9% | 52.1% |
| Mean | 14.4% | 42.6% |
| Median | 13.6% | 43.4% |
| Interquartile 25% (IQ1) | 7.7% | 33.1% |
| Interquartile 75% (IQ3) | 18.4% | 48.3% |
| Interquartile Range (IQR) | 10.7% | 15.2% |
| Standard Deviation (Sample) | 8.8% | 13.5% |
| Standard Deviation (Population) | 8.7% | 13.3% |
Similar Demographics by Bachelor's Degree
Demographics Similar to Hopi by Bachelor's Degree
In terms of bachelor's degree, the demographic groups most similar to Hopi are Pueblo (25.5%, a difference of 0.93%), Inupiat (25.8%, a difference of 2.0%), Lumbee (24.8%, a difference of 2.2%), Yuman (24.5%, a difference of 3.1%), and Immigrants from Mexico (26.1%, a difference of 3.3%).
| Demographics | Rating | Rank | Bachelor's Degree |
| Menominee | 0.0 /100 | #332 | Tragic 27.3% |
| Mexicans | 0.0 /100 | #333 | Tragic 27.1% |
| Arapaho | 0.0 /100 | #334 | Tragic 26.6% |
| Natives/Alaskans | 0.0 /100 | #335 | Tragic 26.3% |
| Immigrants | Mexico | 0.0 /100 | #336 | Tragic 26.1% |
| Inupiat | 0.0 /100 | #337 | Tragic 25.8% |
| Pueblo | 0.0 /100 | #338 | Tragic 25.5% |
| Hopi | 0.0 /100 | #339 | Tragic 25.3% |
| Lumbee | 0.0 /100 | #340 | Tragic 24.8% |
| Yuman | 0.0 /100 | #341 | Tragic 24.5% |
| Yakama | 0.0 /100 | #342 | Tragic 24.5% |
| Tohono O'odham | 0.0 /100 | #343 | Tragic 24.4% |
| Navajo | 0.0 /100 | #344 | Tragic 23.6% |
| Pima | 0.0 /100 | #345 | Tragic 23.2% |
| Houma | 0.0 /100 | #346 | Tragic 21.4% |
Demographics Similar to South Africans by Bachelor's Degree
In terms of bachelor's degree, the demographic groups most similar to South Africans are Immigrants from Kazakhstan (43.4%, a difference of 0.30%), Immigrants from Europe (43.4%, a difference of 0.34%), Argentinean (43.3%, a difference of 0.62%), Zimbabwean (43.3%, a difference of 0.62%), and Immigrants from Netherlands (43.3%, a difference of 0.64%).
| Demographics | Rating | Rank | Bachelor's Degree |
| Immigrants | Austria | 99.9 /100 | #54 | Exceptional 44.2% |
| Immigrants | Bolivia | 99.9 /100 | #55 | Exceptional 44.2% |
| Immigrants | Serbia | 99.9 /100 | #56 | Exceptional 44.1% |
| Paraguayans | 99.9 /100 | #57 | Exceptional 44.0% |
| Immigrants | Czechoslovakia | 99.9 /100 | #58 | Exceptional 44.0% |
| Australians | 99.9 /100 | #59 | Exceptional 44.0% |
| New Zealanders | 99.9 /100 | #60 | Exceptional 44.0% |
| South Africans | 99.8 /100 | #61 | Exceptional 43.6% |
| Immigrants | Kazakhstan | 99.8 /100 | #62 | Exceptional 43.4% |
| Immigrants | Europe | 99.8 /100 | #63 | Exceptional 43.4% |
| Argentineans | 99.7 /100 | #64 | Exceptional 43.3% |
| Zimbabweans | 99.7 /100 | #65 | Exceptional 43.3% |
| Immigrants | Netherlands | 99.7 /100 | #66 | Exceptional 43.3% |
| Egyptians | 99.7 /100 | #67 | Exceptional 43.3% |
| Immigrants | Indonesia | 99.7 /100 | #68 | Exceptional 43.3% |