Hopi vs Immigrants from Switzerland 11th Grade
COMPARE
Hopi
Immigrants from Switzerland
11th Grade
11th Grade Comparison
Hopi
Immigrants from Switzerland
91.7%
11TH GRADE
2.5/ 100
METRIC RATING
239th/ 347
METRIC RANK
93.6%
11TH GRADE
99.3/ 100
METRIC RATING
85th/ 347
METRIC RANK
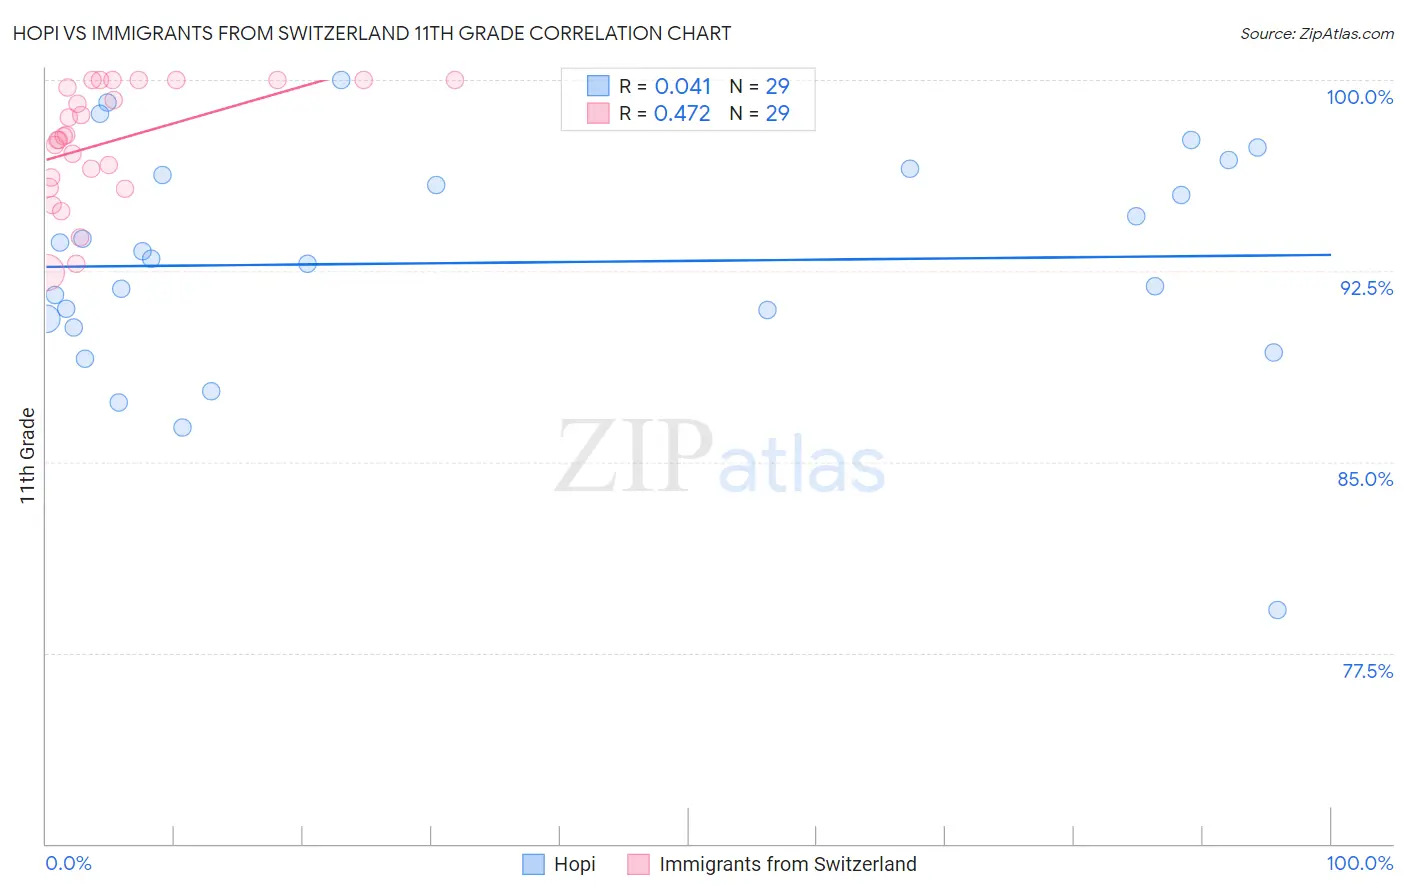
Hopi vs Immigrants from Switzerland 11th Grade Correlation Chart
The statistical analysis conducted on geographies consisting of 74,739,957 people shows no correlation between the proportion of Hopi and percentage of population with at least 11th grade education in the United States with a correlation coefficient (R) of 0.041 and weighted average of 91.7%. Similarly, the statistical analysis conducted on geographies consisting of 148,082,451 people shows a moderate positive correlation between the proportion of Immigrants from Switzerland and percentage of population with at least 11th grade education in the United States with a correlation coefficient (R) of 0.472 and weighted average of 93.6%, a difference of 2.1%.
11th Grade Correlation Summary
| Measurement | Hopi | Immigrants from Switzerland |
| Minimum | 79.2% | 92.4% |
| Maximum | 100.0% | 100.0% |
| Range | 20.8% | 7.6% |
| Mean | 92.8% | 97.6% |
| Median | 93.0% | 97.8% |
| Interquartile 25% (IQ1) | 90.5% | 96.0% |
| Interquartile 75% (IQ3) | 96.4% | 100.0% |
| Interquartile Range (IQR) | 5.9% | 4.0% |
| Standard Deviation (Sample) | 4.5% | 2.3% |
| Standard Deviation (Population) | 4.4% | 2.2% |
Similar Demographics by 11th Grade
Demographics Similar to Hopi by 11th Grade
In terms of 11th grade, the demographic groups most similar to Hopi are Comanche (91.7%, a difference of 0.0%), Subsaharan African (91.7%, a difference of 0.030%), Colombian (91.7%, a difference of 0.030%), Immigrants from Bolivia (91.7%, a difference of 0.030%), and Armenian (91.7%, a difference of 0.040%).
| Demographics | Rating | Rank | 11th Grade |
| Uruguayans | 3.5 /100 | #232 | Tragic 91.8% |
| Cheyenne | 3.3 /100 | #233 | Tragic 91.8% |
| Armenians | 2.9 /100 | #234 | Tragic 91.7% |
| Sub-Saharan Africans | 2.9 /100 | #235 | Tragic 91.7% |
| Colombians | 2.8 /100 | #236 | Tragic 91.7% |
| Immigrants | Bolivia | 2.8 /100 | #237 | Tragic 91.7% |
| Comanche | 2.6 /100 | #238 | Tragic 91.7% |
| Hopi | 2.5 /100 | #239 | Tragic 91.7% |
| South Americans | 2.0 /100 | #240 | Tragic 91.6% |
| Bahamians | 1.8 /100 | #241 | Tragic 91.6% |
| Immigrants | Middle Africa | 1.6 /100 | #242 | Tragic 91.6% |
| Immigrants | Thailand | 1.4 /100 | #243 | Tragic 91.6% |
| Senegalese | 1.4 /100 | #244 | Tragic 91.6% |
| Africans | 1.3 /100 | #245 | Tragic 91.5% |
| Seminole | 1.2 /100 | #246 | Tragic 91.5% |
Demographics Similar to Immigrants from Switzerland by 11th Grade
In terms of 11th grade, the demographic groups most similar to Immigrants from Switzerland are Immigrants from Taiwan (93.6%, a difference of 0.0%), Icelander (93.6%, a difference of 0.010%), Immigrants from South Central Asia (93.6%, a difference of 0.010%), Immigrants from Western Europe (93.6%, a difference of 0.010%), and Cambodian (93.6%, a difference of 0.010%).
| Demographics | Rating | Rank | 11th Grade |
| Soviet Union | 99.5 /100 | #78 | Exceptional 93.7% |
| Immigrants | Denmark | 99.5 /100 | #79 | Exceptional 93.7% |
| Canadians | 99.5 /100 | #80 | Exceptional 93.7% |
| Immigrants | Moldova | 99.5 /100 | #81 | Exceptional 93.7% |
| Immigrants | Saudi Arabia | 99.3 /100 | #82 | Exceptional 93.7% |
| Icelanders | 99.3 /100 | #83 | Exceptional 93.6% |
| Immigrants | Taiwan | 99.3 /100 | #84 | Exceptional 93.6% |
| Immigrants | Switzerland | 99.3 /100 | #85 | Exceptional 93.6% |
| Immigrants | South Central Asia | 99.2 /100 | #86 | Exceptional 93.6% |
| Immigrants | Western Europe | 99.2 /100 | #87 | Exceptional 93.6% |
| Cambodians | 99.2 /100 | #88 | Exceptional 93.6% |
| Burmese | 99.2 /100 | #89 | Exceptional 93.6% |
| Ottawa | 99.2 /100 | #90 | Exceptional 93.6% |
| South Africans | 99.2 /100 | #91 | Exceptional 93.6% |
| Immigrants | Bulgaria | 99.1 /100 | #92 | Exceptional 93.6% |