Apache vs Immigrants from Eritrea 4th Grade
COMPARE
Apache
Immigrants from Eritrea
4th Grade
4th Grade Comparison
Apache
Immigrants from Eritrea
97.6%
4TH GRADE
61.3/ 100
METRIC RATING
160th/ 347
METRIC RANK
96.7%
4TH GRADE
0.0/ 100
METRIC RATING
294th/ 347
METRIC RANK
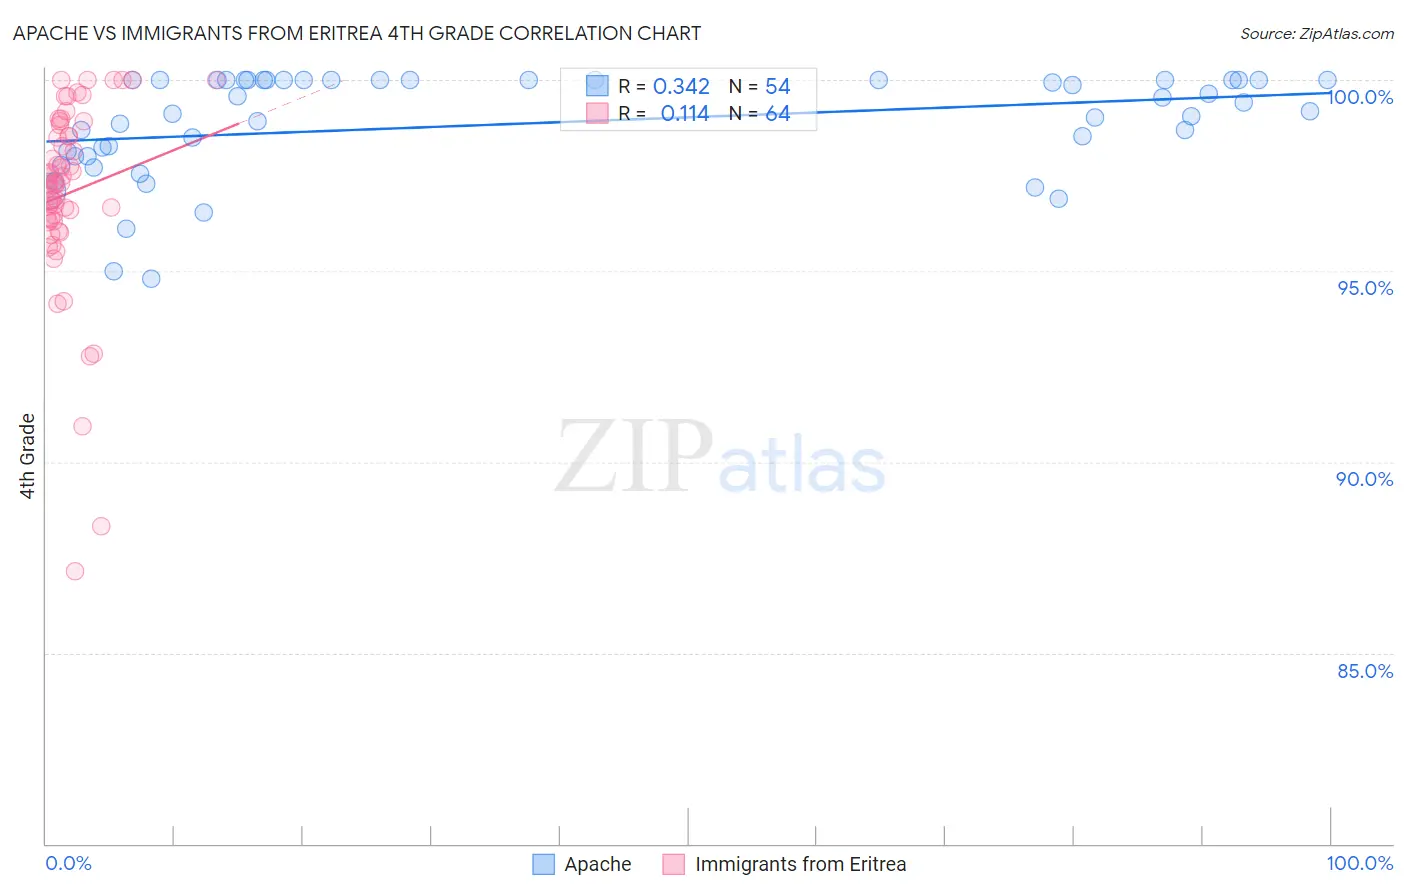
Apache vs Immigrants from Eritrea 4th Grade Correlation Chart
The statistical analysis conducted on geographies consisting of 231,142,814 people shows a mild positive correlation between the proportion of Apache and percentage of population with at least 4th grade education in the United States with a correlation coefficient (R) of 0.342 and weighted average of 97.6%. Similarly, the statistical analysis conducted on geographies consisting of 104,791,429 people shows a poor positive correlation between the proportion of Immigrants from Eritrea and percentage of population with at least 4th grade education in the United States with a correlation coefficient (R) of 0.114 and weighted average of 96.7%, a difference of 0.93%.
4th Grade Correlation Summary
| Measurement | Apache | Immigrants from Eritrea |
| Minimum | 94.8% | 87.1% |
| Maximum | 100.0% | 100.0% |
| Range | 5.2% | 12.9% |
| Mean | 98.9% | 97.0% |
| Median | 99.3% | 97.3% |
| Interquartile 25% (IQ1) | 98.0% | 96.3% |
| Interquartile 75% (IQ3) | 100.0% | 98.7% |
| Interquartile Range (IQR) | 2.0% | 2.3% |
| Standard Deviation (Sample) | 1.4% | 2.5% |
| Standard Deviation (Population) | 1.3% | 2.5% |
Similar Demographics by 4th Grade
Demographics Similar to Apache by 4th Grade
In terms of 4th grade, the demographic groups most similar to Apache are Marshallese (97.6%, a difference of 0.0%), Bermudan (97.6%, a difference of 0.0%), Immigrants from Iran (97.6%, a difference of 0.0%), Immigrants from Italy (97.6%, a difference of 0.010%), and Ugandan (97.6%, a difference of 0.010%).
| Demographics | Rating | Rank | 4th Grade |
| Immigrants | Eastern Europe | 71.3 /100 | #153 | Good 97.6% |
| Immigrants | Russia | 67.0 /100 | #154 | Good 97.6% |
| Albanians | 67.0 /100 | #155 | Good 97.6% |
| Immigrants | Jordan | 66.9 /100 | #156 | Good 97.6% |
| Immigrants | Bosnia and Herzegovina | 66.0 /100 | #157 | Good 97.6% |
| French American Indians | 65.9 /100 | #158 | Good 97.6% |
| Immigrants | Italy | 63.7 /100 | #159 | Good 97.6% |
| Apache | 61.3 /100 | #160 | Good 97.6% |
| Marshallese | 60.8 /100 | #161 | Good 97.6% |
| Bermudans | 60.5 /100 | #162 | Good 97.6% |
| Immigrants | Iran | 60.3 /100 | #163 | Good 97.6% |
| Ugandans | 58.9 /100 | #164 | Average 97.6% |
| Venezuelans | 58.7 /100 | #165 | Average 97.6% |
| Kenyans | 56.5 /100 | #166 | Average 97.5% |
| Immigrants | Poland | 55.9 /100 | #167 | Average 97.5% |
Demographics Similar to Immigrants from Eritrea by 4th Grade
In terms of 4th grade, the demographic groups most similar to Immigrants from Eritrea are Puerto Rican (96.7%, a difference of 0.020%), Immigrants from Portugal (96.6%, a difference of 0.020%), Somali (96.6%, a difference of 0.030%), Malaysian (96.7%, a difference of 0.040%), and Immigrants from Grenada (96.7%, a difference of 0.050%).
| Demographics | Rating | Rank | 4th Grade |
| Houma | 0.0 /100 | #287 | Tragic 96.8% |
| Immigrants | Afghanistan | 0.0 /100 | #288 | Tragic 96.8% |
| Immigrants | West Indies | 0.0 /100 | #289 | Tragic 96.7% |
| British West Indians | 0.0 /100 | #290 | Tragic 96.7% |
| Immigrants | Grenada | 0.0 /100 | #291 | Tragic 96.7% |
| Malaysians | 0.0 /100 | #292 | Tragic 96.7% |
| Puerto Ricans | 0.0 /100 | #293 | Tragic 96.7% |
| Immigrants | Eritrea | 0.0 /100 | #294 | Tragic 96.7% |
| Immigrants | Portugal | 0.0 /100 | #295 | Tragic 96.6% |
| Somalis | 0.0 /100 | #296 | Tragic 96.6% |
| Immigrants | Somalia | 0.0 /100 | #297 | Tragic 96.5% |
| Haitians | 0.0 /100 | #298 | Tragic 96.5% |
| Immigrants | Dominica | 0.0 /100 | #299 | Tragic 96.5% |
| Immigrants | South Eastern Asia | 0.0 /100 | #300 | Tragic 96.5% |
| Immigrants | Immigrants | 0.0 /100 | #301 | Tragic 96.5% |