Hispanic or Latino vs Jordanian Unemployment Among Seniors over 65 years
COMPARE
Hispanic or Latino
Jordanian
Unemployment Among Seniors over 65 years
Unemployment Among Seniors over 65 years Comparison
Hispanics or Latinos
Jordanians
5.6%
UNEMPLOYMENT AMONG SENIORS OVER 65 YEARS
0.0/ 100
METRIC RATING
301st/ 347
METRIC RANK
4.9%
UNEMPLOYMENT AMONG SENIORS OVER 65 YEARS
99.9/ 100
METRIC RATING
44th/ 347
METRIC RANK
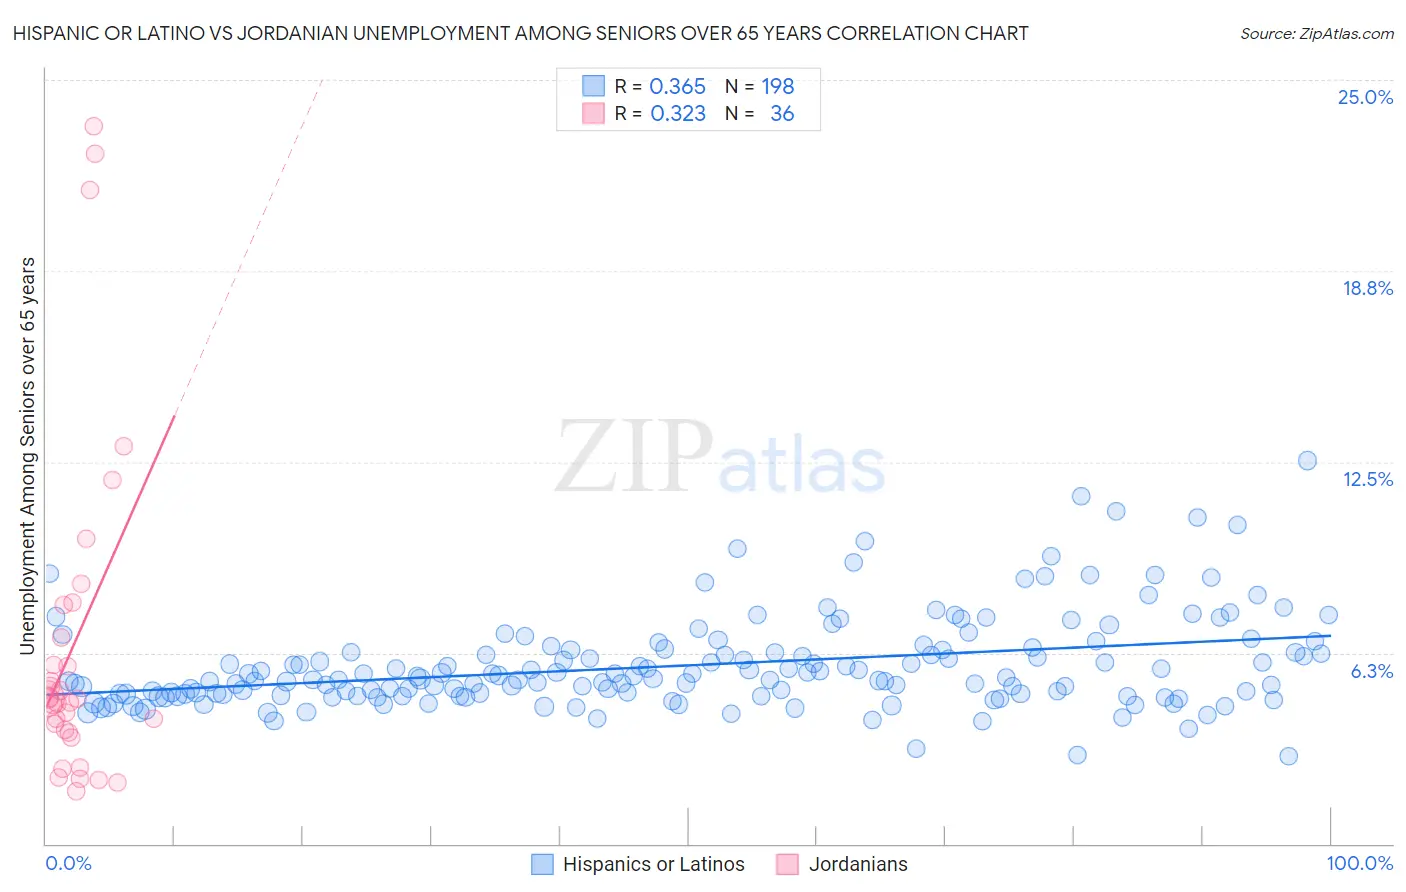
Hispanic or Latino vs Jordanian Unemployment Among Seniors over 65 years Correlation Chart
The statistical analysis conducted on geographies consisting of 464,313,086 people shows a mild positive correlation between the proportion of Hispanics or Latinos and unemployment rate amomg seniors over the age of 65 in the United States with a correlation coefficient (R) of 0.365 and weighted average of 5.6%. Similarly, the statistical analysis conducted on geographies consisting of 160,431,135 people shows a mild positive correlation between the proportion of Jordanians and unemployment rate amomg seniors over the age of 65 in the United States with a correlation coefficient (R) of 0.323 and weighted average of 4.9%, a difference of 14.8%.
Unemployment Among Seniors over 65 years Correlation Summary
| Measurement | Hispanic or Latino | Jordanian |
| Minimum | 2.8% | 1.7% |
| Maximum | 12.5% | 23.5% |
| Range | 9.7% | 21.8% |
| Mean | 5.8% | 6.5% |
| Median | 5.4% | 4.7% |
| Interquartile 25% (IQ1) | 4.9% | 3.7% |
| Interquartile 75% (IQ3) | 6.3% | 7.3% |
| Interquartile Range (IQR) | 1.5% | 3.6% |
| Standard Deviation (Sample) | 1.5% | 5.5% |
| Standard Deviation (Population) | 1.5% | 5.5% |
Similar Demographics by Unemployment Among Seniors over 65 years
Demographics Similar to Hispanics or Latinos by Unemployment Among Seniors over 65 years
In terms of unemployment among seniors over 65 years, the demographic groups most similar to Hispanics or Latinos are Guatemalan (5.6%, a difference of 0.16%), Zimbabwean (5.6%, a difference of 0.20%), Guyanese (5.6%, a difference of 0.26%), Immigrants from Latin America (5.6%, a difference of 0.26%), and Liberian (5.6%, a difference of 0.33%).
| Demographics | Rating | Rank | Unemployment Among Seniors over 65 years |
| Armenians | 0.0 /100 | #294 | Tragic 5.5% |
| Cheyenne | 0.0 /100 | #295 | Tragic 5.5% |
| Cape Verdeans | 0.0 /100 | #296 | Tragic 5.5% |
| Yaqui | 0.0 /100 | #297 | Tragic 5.5% |
| Immigrants | West Indies | 0.0 /100 | #298 | Tragic 5.6% |
| Guyanese | 0.0 /100 | #299 | Tragic 5.6% |
| Zimbabweans | 0.0 /100 | #300 | Tragic 5.6% |
| Hispanics or Latinos | 0.0 /100 | #301 | Tragic 5.6% |
| Guatemalans | 0.0 /100 | #302 | Tragic 5.6% |
| Immigrants | Latin America | 0.0 /100 | #303 | Tragic 5.6% |
| Liberians | 0.0 /100 | #304 | Tragic 5.6% |
| Mexicans | 0.0 /100 | #305 | Tragic 5.6% |
| Ecuadorians | 0.0 /100 | #306 | Tragic 5.6% |
| Portuguese | 0.0 /100 | #307 | Tragic 5.6% |
| Immigrants | St. Vincent and the Grenadines | 0.0 /100 | #308 | Tragic 5.6% |
Demographics Similar to Jordanians by Unemployment Among Seniors over 65 years
In terms of unemployment among seniors over 65 years, the demographic groups most similar to Jordanians are Ethiopian (4.9%, a difference of 0.040%), Swiss (4.8%, a difference of 0.10%), Luxembourger (4.8%, a difference of 0.10%), Kiowa (4.8%, a difference of 0.11%), and Immigrants from Sweden (4.8%, a difference of 0.15%).
| Demographics | Rating | Rank | Unemployment Among Seniors over 65 years |
| Bulgarians | 99.9 /100 | #37 | Exceptional 4.8% |
| Immigrants | India | 99.9 /100 | #38 | Exceptional 4.8% |
| Macedonians | 99.9 /100 | #39 | Exceptional 4.8% |
| Immigrants | Sweden | 99.9 /100 | #40 | Exceptional 4.8% |
| Kiowa | 99.9 /100 | #41 | Exceptional 4.8% |
| Swiss | 99.9 /100 | #42 | Exceptional 4.8% |
| Luxembourgers | 99.9 /100 | #43 | Exceptional 4.8% |
| Jordanians | 99.9 /100 | #44 | Exceptional 4.9% |
| Ethiopians | 99.9 /100 | #45 | Exceptional 4.9% |
| Immigrants | Jordan | 99.9 /100 | #46 | Exceptional 4.9% |
| Germans | 99.9 /100 | #47 | Exceptional 4.9% |
| Choctaw | 99.9 /100 | #48 | Exceptional 4.9% |
| Immigrants | Kenya | 99.9 /100 | #49 | Exceptional 4.9% |
| Immigrants | Austria | 99.9 /100 | #50 | Exceptional 4.9% |
| Scotch-Irish | 99.9 /100 | #51 | Exceptional 4.9% |