Hispanic or Latino vs Immigrants from Lebanon 10th Grade
COMPARE
Hispanic or Latino
Immigrants from Lebanon
10th Grade
10th Grade Comparison
Hispanics or Latinos
Immigrants from Lebanon
88.9%
10TH GRADE
0.0/ 100
METRIC RATING
334th/ 347
METRIC RANK
93.7%
10TH GRADE
47.1/ 100
METRIC RATING
177th/ 347
METRIC RANK
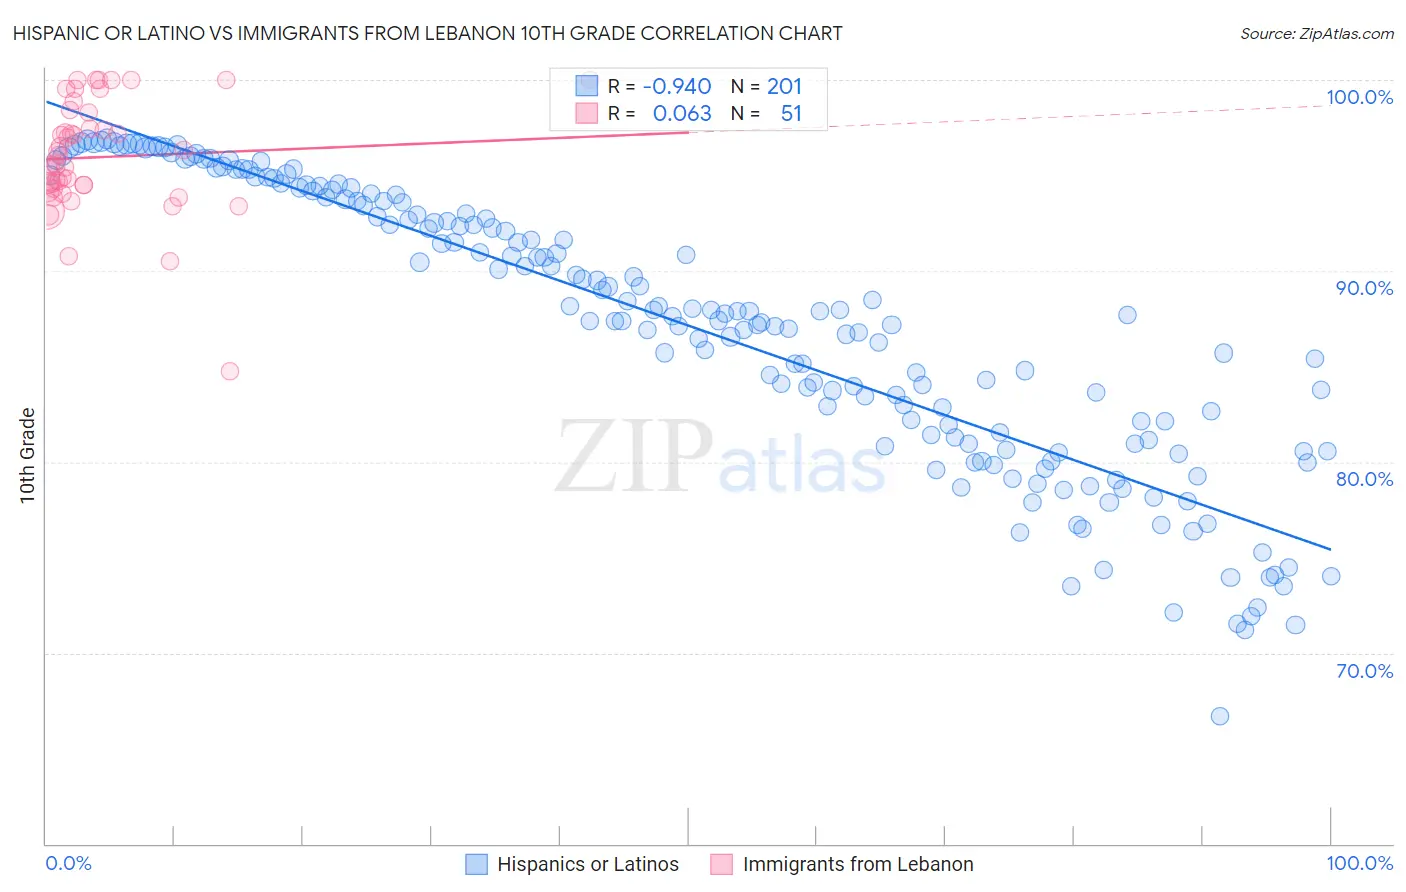
Hispanic or Latino vs Immigrants from Lebanon 10th Grade Correlation Chart
The statistical analysis conducted on geographies consisting of 578,613,916 people shows a near-perfect negative correlation between the proportion of Hispanics or Latinos and percentage of population with at least 10th grade education in the United States with a correlation coefficient (R) of -0.940 and weighted average of 88.9%. Similarly, the statistical analysis conducted on geographies consisting of 217,083,357 people shows a slight positive correlation between the proportion of Immigrants from Lebanon and percentage of population with at least 10th grade education in the United States with a correlation coefficient (R) of 0.063 and weighted average of 93.7%, a difference of 5.5%.
10th Grade Correlation Summary
| Measurement | Hispanic or Latino | Immigrants from Lebanon |
| Minimum | 66.7% | 84.7% |
| Maximum | 96.9% | 100.0% |
| Range | 30.2% | 15.3% |
| Mean | 87.1% | 96.0% |
| Median | 87.8% | 95.6% |
| Interquartile 25% (IQ1) | 81.2% | 94.3% |
| Interquartile 75% (IQ3) | 93.7% | 98.3% |
| Interquartile Range (IQR) | 12.5% | 4.0% |
| Standard Deviation (Sample) | 7.3% | 3.0% |
| Standard Deviation (Population) | 7.2% | 2.9% |
Similar Demographics by 10th Grade
Demographics Similar to Hispanics or Latinos by 10th Grade
In terms of 10th grade, the demographic groups most similar to Hispanics or Latinos are Honduran (89.0%, a difference of 0.12%), Immigrants from the Azores (89.0%, a difference of 0.15%), Immigrants from Dominican Republic (88.7%, a difference of 0.18%), Mexican American Indian (89.0%, a difference of 0.19%), and Immigrants from Yemen (89.1%, a difference of 0.22%).
| Demographics | Rating | Rank | 10th Grade |
| Immigrants | Nicaragua | 0.0 /100 | #327 | Tragic 89.5% |
| Immigrants | Cabo Verde | 0.0 /100 | #328 | Tragic 89.5% |
| Dominicans | 0.0 /100 | #329 | Tragic 89.4% |
| Immigrants | Yemen | 0.0 /100 | #330 | Tragic 89.1% |
| Mexican American Indians | 0.0 /100 | #331 | Tragic 89.0% |
| Immigrants | Azores | 0.0 /100 | #332 | Tragic 89.0% |
| Hondurans | 0.0 /100 | #333 | Tragic 89.0% |
| Hispanics or Latinos | 0.0 /100 | #334 | Tragic 88.9% |
| Immigrants | Dominican Republic | 0.0 /100 | #335 | Tragic 88.7% |
| Immigrants | Honduras | 0.0 /100 | #336 | Tragic 88.5% |
| Central Americans | 0.0 /100 | #337 | Tragic 88.4% |
| Immigrants | Latin America | 0.0 /100 | #338 | Tragic 88.3% |
| Guatemalans | 0.0 /100 | #339 | Tragic 87.9% |
| Mexicans | 0.0 /100 | #340 | Tragic 87.8% |
| Salvadorans | 0.0 /100 | #341 | Tragic 87.5% |
Demographics Similar to Immigrants from Lebanon by 10th Grade
In terms of 10th grade, the demographic groups most similar to Immigrants from Lebanon are Immigrants from Argentina (93.7%, a difference of 0.0%), Sierra Leonean (93.7%, a difference of 0.010%), Immigrants from Nepal (93.7%, a difference of 0.020%), Paraguayan (93.7%, a difference of 0.020%), and French American Indian (93.7%, a difference of 0.030%).
| Demographics | Rating | Rank | 10th Grade |
| Immigrants | Venezuela | 53.9 /100 | #170 | Average 93.8% |
| Immigrants | Albania | 52.4 /100 | #171 | Average 93.8% |
| French American Indians | 50.9 /100 | #172 | Average 93.7% |
| Spaniards | 50.3 /100 | #173 | Average 93.7% |
| Argentineans | 50.0 /100 | #174 | Average 93.7% |
| Immigrants | Nepal | 49.6 /100 | #175 | Average 93.7% |
| Immigrants | Argentina | 47.1 /100 | #176 | Average 93.7% |
| Immigrants | Lebanon | 47.1 /100 | #177 | Average 93.7% |
| Sierra Leoneans | 46.1 /100 | #178 | Average 93.7% |
| Paraguayans | 45.3 /100 | #179 | Average 93.7% |
| Blackfeet | 42.8 /100 | #180 | Average 93.7% |
| Immigrants | Northern Africa | 41.6 /100 | #181 | Average 93.7% |
| Colville | 38.8 /100 | #182 | Fair 93.6% |
| Guamanians/Chamorros | 37.1 /100 | #183 | Fair 93.6% |
| Choctaw | 36.6 /100 | #184 | Fair 93.6% |