Asian vs Immigrants from Lebanon 10th Grade
COMPARE
Asian
Immigrants from Lebanon
10th Grade
10th Grade Comparison
Asians
Immigrants from Lebanon
93.5%
10TH GRADE
23.0/ 100
METRIC RATING
199th/ 347
METRIC RANK
93.7%
10TH GRADE
47.1/ 100
METRIC RATING
177th/ 347
METRIC RANK
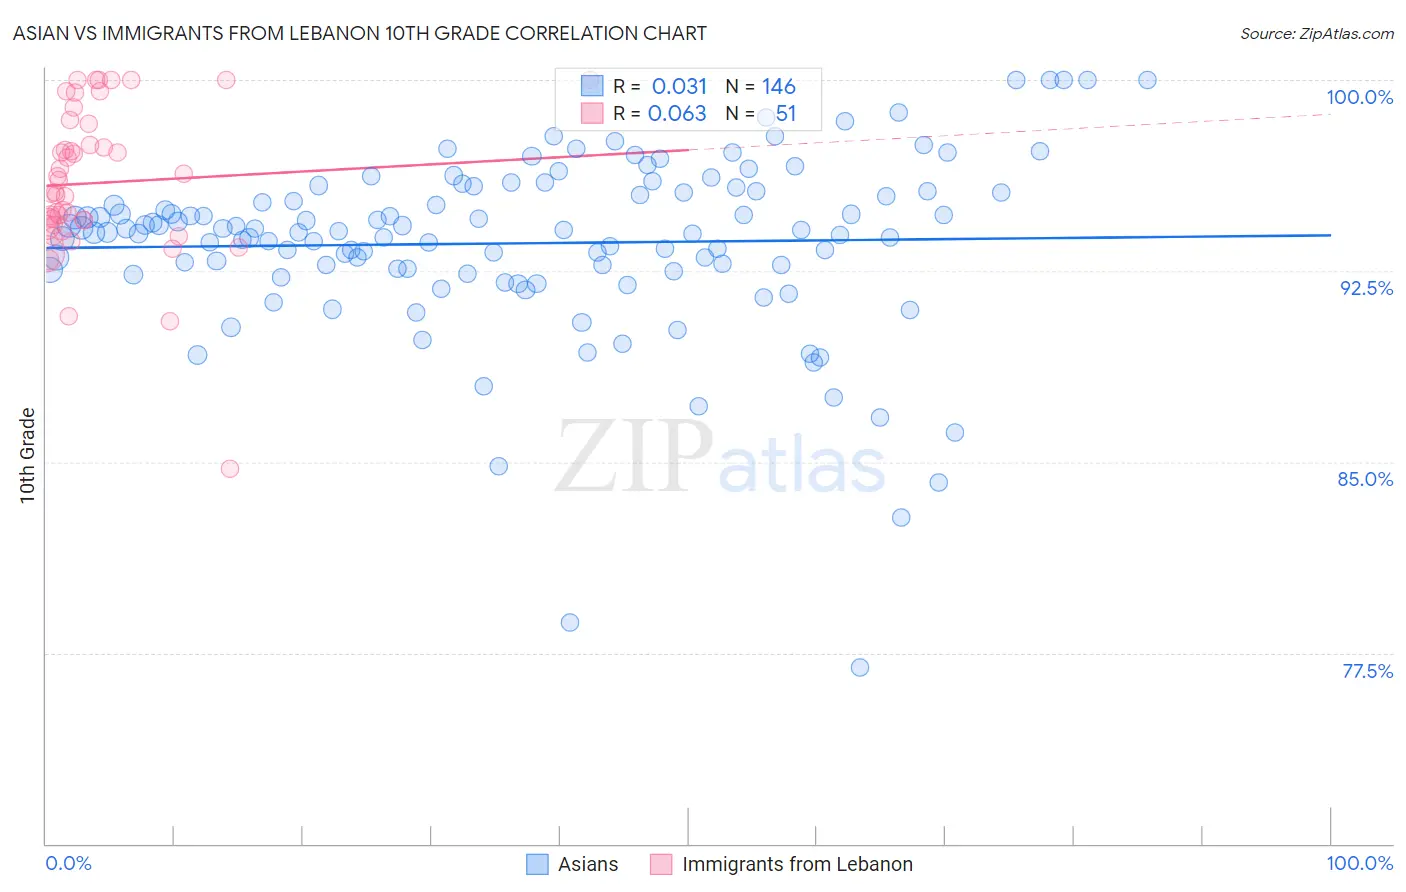
Asian vs Immigrants from Lebanon 10th Grade Correlation Chart
The statistical analysis conducted on geographies consisting of 550,778,127 people shows no correlation between the proportion of Asians and percentage of population with at least 10th grade education in the United States with a correlation coefficient (R) of 0.031 and weighted average of 93.5%. Similarly, the statistical analysis conducted on geographies consisting of 217,083,357 people shows a slight positive correlation between the proportion of Immigrants from Lebanon and percentage of population with at least 10th grade education in the United States with a correlation coefficient (R) of 0.063 and weighted average of 93.7%, a difference of 0.24%.
10th Grade Correlation Summary
| Measurement | Asian | Immigrants from Lebanon |
| Minimum | 76.9% | 84.7% |
| Maximum | 100.0% | 100.0% |
| Range | 23.1% | 15.3% |
| Mean | 93.6% | 96.0% |
| Median | 94.0% | 95.6% |
| Interquartile 25% (IQ1) | 92.5% | 94.3% |
| Interquartile 75% (IQ3) | 95.6% | 98.3% |
| Interquartile Range (IQR) | 3.1% | 4.0% |
| Standard Deviation (Sample) | 3.5% | 3.0% |
| Standard Deviation (Population) | 3.5% | 2.9% |
Similar Demographics by 10th Grade
Demographics Similar to Asians by 10th Grade
In terms of 10th grade, the demographic groups most similar to Asians are Immigrants from Micronesia (93.5%, a difference of 0.0%), Pueblo (93.5%, a difference of 0.010%), Hopi (93.5%, a difference of 0.010%), Hawaiian (93.5%, a difference of 0.020%), and Moroccan (93.5%, a difference of 0.030%).
| Demographics | Rating | Rank | 10th Grade |
| Immigrants | Malaysia | 28.0 /100 | #192 | Fair 93.5% |
| Panamanians | 28.0 /100 | #193 | Fair 93.5% |
| Immigrants | Morocco | 26.9 /100 | #194 | Fair 93.5% |
| Cheyenne | 26.8 /100 | #195 | Fair 93.5% |
| Moroccans | 25.3 /100 | #196 | Fair 93.5% |
| Pueblo | 23.9 /100 | #197 | Fair 93.5% |
| Immigrants | Micronesia | 23.2 /100 | #198 | Fair 93.5% |
| Asians | 23.0 /100 | #199 | Fair 93.5% |
| Hopi | 22.2 /100 | #200 | Fair 93.5% |
| Hawaiians | 21.8 /100 | #201 | Fair 93.5% |
| Immigrants | Uganda | 20.9 /100 | #202 | Fair 93.5% |
| Immigrants | Western Asia | 20.6 /100 | #203 | Fair 93.4% |
| Ute | 20.3 /100 | #204 | Fair 93.4% |
| Immigrants | Indonesia | 20.2 /100 | #205 | Fair 93.4% |
| Immigrants | Sudan | 20.0 /100 | #206 | Fair 93.4% |
Demographics Similar to Immigrants from Lebanon by 10th Grade
In terms of 10th grade, the demographic groups most similar to Immigrants from Lebanon are Immigrants from Argentina (93.7%, a difference of 0.0%), Sierra Leonean (93.7%, a difference of 0.010%), Immigrants from Nepal (93.7%, a difference of 0.020%), Paraguayan (93.7%, a difference of 0.020%), and French American Indian (93.7%, a difference of 0.030%).
| Demographics | Rating | Rank | 10th Grade |
| Immigrants | Venezuela | 53.9 /100 | #170 | Average 93.8% |
| Immigrants | Albania | 52.4 /100 | #171 | Average 93.8% |
| French American Indians | 50.9 /100 | #172 | Average 93.7% |
| Spaniards | 50.3 /100 | #173 | Average 93.7% |
| Argentineans | 50.0 /100 | #174 | Average 93.7% |
| Immigrants | Nepal | 49.6 /100 | #175 | Average 93.7% |
| Immigrants | Argentina | 47.1 /100 | #176 | Average 93.7% |
| Immigrants | Lebanon | 47.1 /100 | #177 | Average 93.7% |
| Sierra Leoneans | 46.1 /100 | #178 | Average 93.7% |
| Paraguayans | 45.3 /100 | #179 | Average 93.7% |
| Blackfeet | 42.8 /100 | #180 | Average 93.7% |
| Immigrants | Northern Africa | 41.6 /100 | #181 | Average 93.7% |
| Colville | 38.8 /100 | #182 | Fair 93.6% |
| Guamanians/Chamorros | 37.1 /100 | #183 | Fair 93.6% |
| Choctaw | 36.6 /100 | #184 | Fair 93.6% |