Ukrainian vs Immigrants from Lebanon 10th Grade
COMPARE
Ukrainian
Immigrants from Lebanon
10th Grade
10th Grade Comparison
Ukrainians
Immigrants from Lebanon
95.0%
10TH GRADE
99.8/ 100
METRIC RATING
57th/ 347
METRIC RANK
93.7%
10TH GRADE
47.1/ 100
METRIC RATING
177th/ 347
METRIC RANK
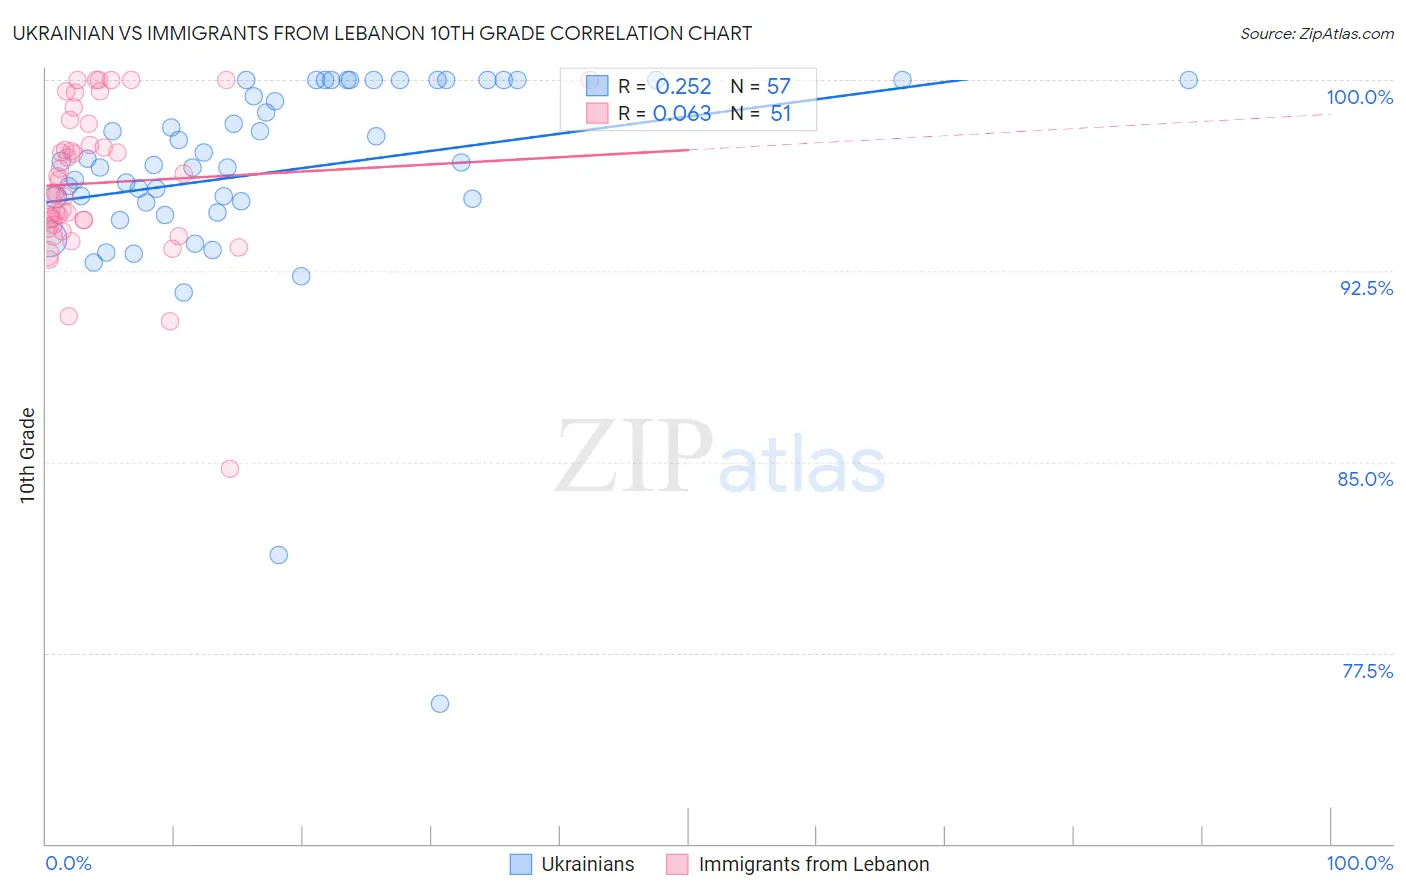
Ukrainian vs Immigrants from Lebanon 10th Grade Correlation Chart
The statistical analysis conducted on geographies consisting of 448,698,772 people shows a weak positive correlation between the proportion of Ukrainians and percentage of population with at least 10th grade education in the United States with a correlation coefficient (R) of 0.252 and weighted average of 95.0%. Similarly, the statistical analysis conducted on geographies consisting of 217,083,357 people shows a slight positive correlation between the proportion of Immigrants from Lebanon and percentage of population with at least 10th grade education in the United States with a correlation coefficient (R) of 0.063 and weighted average of 93.7%, a difference of 1.4%.
10th Grade Correlation Summary
| Measurement | Ukrainian | Immigrants from Lebanon |
| Minimum | 75.5% | 84.7% |
| Maximum | 100.0% | 100.0% |
| Range | 24.5% | 15.3% |
| Mean | 96.4% | 96.0% |
| Median | 96.7% | 95.6% |
| Interquartile 25% (IQ1) | 95.2% | 94.3% |
| Interquartile 75% (IQ3) | 100.0% | 98.3% |
| Interquartile Range (IQR) | 4.8% | 4.0% |
| Standard Deviation (Sample) | 4.3% | 3.0% |
| Standard Deviation (Population) | 4.2% | 2.9% |
Similar Demographics by 10th Grade
Demographics Similar to Ukrainians by 10th Grade
In terms of 10th grade, the demographic groups most similar to Ukrainians are New Zealander (95.0%, a difference of 0.0%), Aleut (95.0%, a difference of 0.0%), Immigrants from Ireland (95.0%, a difference of 0.010%), Celtic (95.0%, a difference of 0.010%), and Immigrants from Lithuania (95.0%, a difference of 0.020%).
| Demographics | Rating | Rank | 10th Grade |
| Immigrants | Canada | 99.8 /100 | #50 | Exceptional 95.1% |
| Austrians | 99.8 /100 | #51 | Exceptional 95.1% |
| Ottawa | 99.8 /100 | #52 | Exceptional 95.1% |
| Immigrants | North America | 99.8 /100 | #53 | Exceptional 95.0% |
| Immigrants | Lithuania | 99.8 /100 | #54 | Exceptional 95.0% |
| Immigrants | Ireland | 99.8 /100 | #55 | Exceptional 95.0% |
| New Zealanders | 99.8 /100 | #56 | Exceptional 95.0% |
| Ukrainians | 99.8 /100 | #57 | Exceptional 95.0% |
| Aleuts | 99.8 /100 | #58 | Exceptional 95.0% |
| Celtics | 99.8 /100 | #59 | Exceptional 95.0% |
| Cypriots | 99.8 /100 | #60 | Exceptional 95.0% |
| Chippewa | 99.8 /100 | #61 | Exceptional 95.0% |
| Thais | 99.8 /100 | #62 | Exceptional 95.0% |
| Immigrants | Singapore | 99.8 /100 | #63 | Exceptional 95.0% |
| Native Hawaiians | 99.7 /100 | #64 | Exceptional 95.0% |
Demographics Similar to Immigrants from Lebanon by 10th Grade
In terms of 10th grade, the demographic groups most similar to Immigrants from Lebanon are Immigrants from Argentina (93.7%, a difference of 0.0%), Sierra Leonean (93.7%, a difference of 0.010%), Immigrants from Nepal (93.7%, a difference of 0.020%), Paraguayan (93.7%, a difference of 0.020%), and French American Indian (93.7%, a difference of 0.030%).
| Demographics | Rating | Rank | 10th Grade |
| Immigrants | Venezuela | 53.9 /100 | #170 | Average 93.8% |
| Immigrants | Albania | 52.4 /100 | #171 | Average 93.8% |
| French American Indians | 50.9 /100 | #172 | Average 93.7% |
| Spaniards | 50.3 /100 | #173 | Average 93.7% |
| Argentineans | 50.0 /100 | #174 | Average 93.7% |
| Immigrants | Nepal | 49.6 /100 | #175 | Average 93.7% |
| Immigrants | Argentina | 47.1 /100 | #176 | Average 93.7% |
| Immigrants | Lebanon | 47.1 /100 | #177 | Average 93.7% |
| Sierra Leoneans | 46.1 /100 | #178 | Average 93.7% |
| Paraguayans | 45.3 /100 | #179 | Average 93.7% |
| Blackfeet | 42.8 /100 | #180 | Average 93.7% |
| Immigrants | Northern Africa | 41.6 /100 | #181 | Average 93.7% |
| Colville | 38.8 /100 | #182 | Fair 93.6% |
| Guamanians/Chamorros | 37.1 /100 | #183 | Fair 93.6% |
| Choctaw | 36.6 /100 | #184 | Fair 93.6% |