Hispanic or Latino vs Alaskan Athabascan 10th Grade
COMPARE
Hispanic or Latino
Alaskan Athabascan
10th Grade
10th Grade Comparison
Hispanics or Latinos
Alaskan Athabascans
88.9%
10TH GRADE
0.0/ 100
METRIC RATING
334th/ 347
METRIC RANK
95.4%
10TH GRADE
100.0/ 100
METRIC RATING
27th/ 347
METRIC RANK
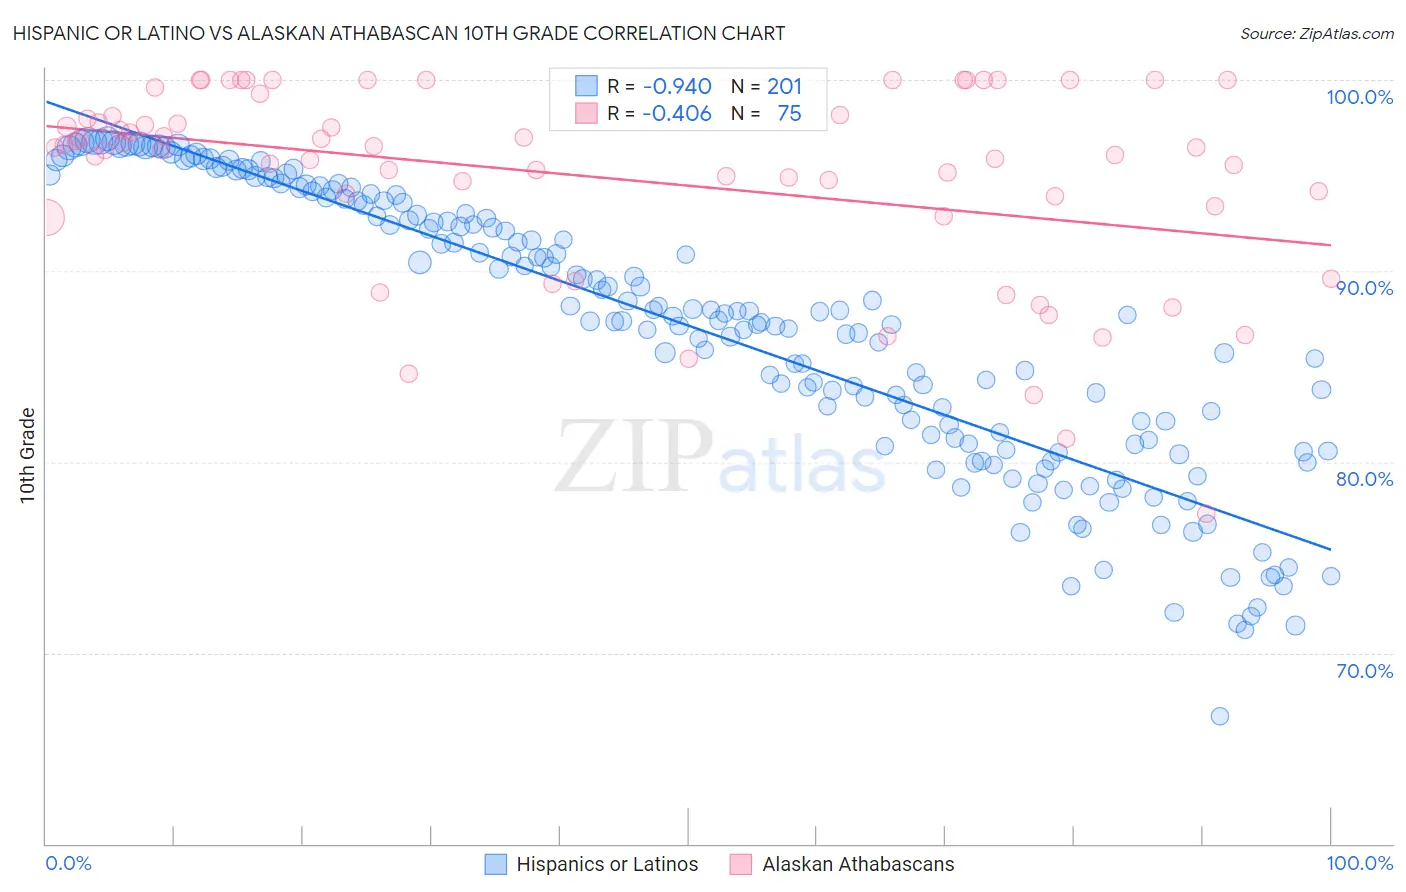
Hispanic or Latino vs Alaskan Athabascan 10th Grade Correlation Chart
The statistical analysis conducted on geographies consisting of 578,613,916 people shows a near-perfect negative correlation between the proportion of Hispanics or Latinos and percentage of population with at least 10th grade education in the United States with a correlation coefficient (R) of -0.940 and weighted average of 88.9%. Similarly, the statistical analysis conducted on geographies consisting of 45,820,444 people shows a moderate negative correlation between the proportion of Alaskan Athabascans and percentage of population with at least 10th grade education in the United States with a correlation coefficient (R) of -0.406 and weighted average of 95.4%, a difference of 7.4%.
10th Grade Correlation Summary
| Measurement | Hispanic or Latino | Alaskan Athabascan |
| Minimum | 66.7% | 77.3% |
| Maximum | 96.9% | 100.0% |
| Range | 30.2% | 22.7% |
| Mean | 87.1% | 94.9% |
| Median | 87.8% | 96.4% |
| Interquartile 25% (IQ1) | 81.2% | 93.4% |
| Interquartile 75% (IQ3) | 93.7% | 98.2% |
| Interquartile Range (IQR) | 12.5% | 4.8% |
| Standard Deviation (Sample) | 7.3% | 5.1% |
| Standard Deviation (Population) | 7.2% | 5.1% |
Similar Demographics by 10th Grade
Demographics Similar to Hispanics or Latinos by 10th Grade
In terms of 10th grade, the demographic groups most similar to Hispanics or Latinos are Honduran (89.0%, a difference of 0.12%), Immigrants from the Azores (89.0%, a difference of 0.15%), Immigrants from Dominican Republic (88.7%, a difference of 0.18%), Mexican American Indian (89.0%, a difference of 0.19%), and Immigrants from Yemen (89.1%, a difference of 0.22%).
| Demographics | Rating | Rank | 10th Grade |
| Immigrants | Nicaragua | 0.0 /100 | #327 | Tragic 89.5% |
| Immigrants | Cabo Verde | 0.0 /100 | #328 | Tragic 89.5% |
| Dominicans | 0.0 /100 | #329 | Tragic 89.4% |
| Immigrants | Yemen | 0.0 /100 | #330 | Tragic 89.1% |
| Mexican American Indians | 0.0 /100 | #331 | Tragic 89.0% |
| Immigrants | Azores | 0.0 /100 | #332 | Tragic 89.0% |
| Hondurans | 0.0 /100 | #333 | Tragic 89.0% |
| Hispanics or Latinos | 0.0 /100 | #334 | Tragic 88.9% |
| Immigrants | Dominican Republic | 0.0 /100 | #335 | Tragic 88.7% |
| Immigrants | Honduras | 0.0 /100 | #336 | Tragic 88.5% |
| Central Americans | 0.0 /100 | #337 | Tragic 88.4% |
| Immigrants | Latin America | 0.0 /100 | #338 | Tragic 88.3% |
| Guatemalans | 0.0 /100 | #339 | Tragic 87.9% |
| Mexicans | 0.0 /100 | #340 | Tragic 87.8% |
| Salvadorans | 0.0 /100 | #341 | Tragic 87.5% |
Demographics Similar to Alaskan Athabascans by 10th Grade
In terms of 10th grade, the demographic groups most similar to Alaskan Athabascans are Luxembourger (95.4%, a difference of 0.0%), Welsh (95.5%, a difference of 0.020%), Bulgarian (95.4%, a difference of 0.030%), European (95.5%, a difference of 0.040%), and Maltese (95.5%, a difference of 0.040%).
| Demographics | Rating | Rank | 10th Grade |
| Chinese | 100.0 /100 | #20 | Exceptional 95.5% |
| Dutch | 100.0 /100 | #21 | Exceptional 95.5% |
| Eastern Europeans | 100.0 /100 | #22 | Exceptional 95.5% |
| Czechs | 100.0 /100 | #23 | Exceptional 95.5% |
| Europeans | 100.0 /100 | #24 | Exceptional 95.5% |
| Maltese | 100.0 /100 | #25 | Exceptional 95.5% |
| Welsh | 100.0 /100 | #26 | Exceptional 95.5% |
| Alaskan Athabascans | 100.0 /100 | #27 | Exceptional 95.4% |
| Luxembourgers | 100.0 /100 | #28 | Exceptional 95.4% |
| Bulgarians | 100.0 /100 | #29 | Exceptional 95.4% |
| Belgians | 100.0 /100 | #30 | Exceptional 95.4% |
| Iranians | 100.0 /100 | #31 | Exceptional 95.3% |
| Hungarians | 100.0 /100 | #32 | Exceptional 95.3% |
| French | 100.0 /100 | #33 | Exceptional 95.3% |
| British | 99.9 /100 | #34 | Exceptional 95.3% |