Immigrants from Oceania vs Immigrants from England Doctorate Degree
COMPARE
Immigrants from Oceania
Immigrants from England
Doctorate Degree
Doctorate Degree Comparison
Immigrants from Oceania
Immigrants from England
1.9%
DOCTORATE DEGREE
74.0/ 100
METRIC RATING
153rd/ 347
METRIC RANK
2.2%
DOCTORATE DEGREE
99.6/ 100
METRIC RATING
84th/ 347
METRIC RANK
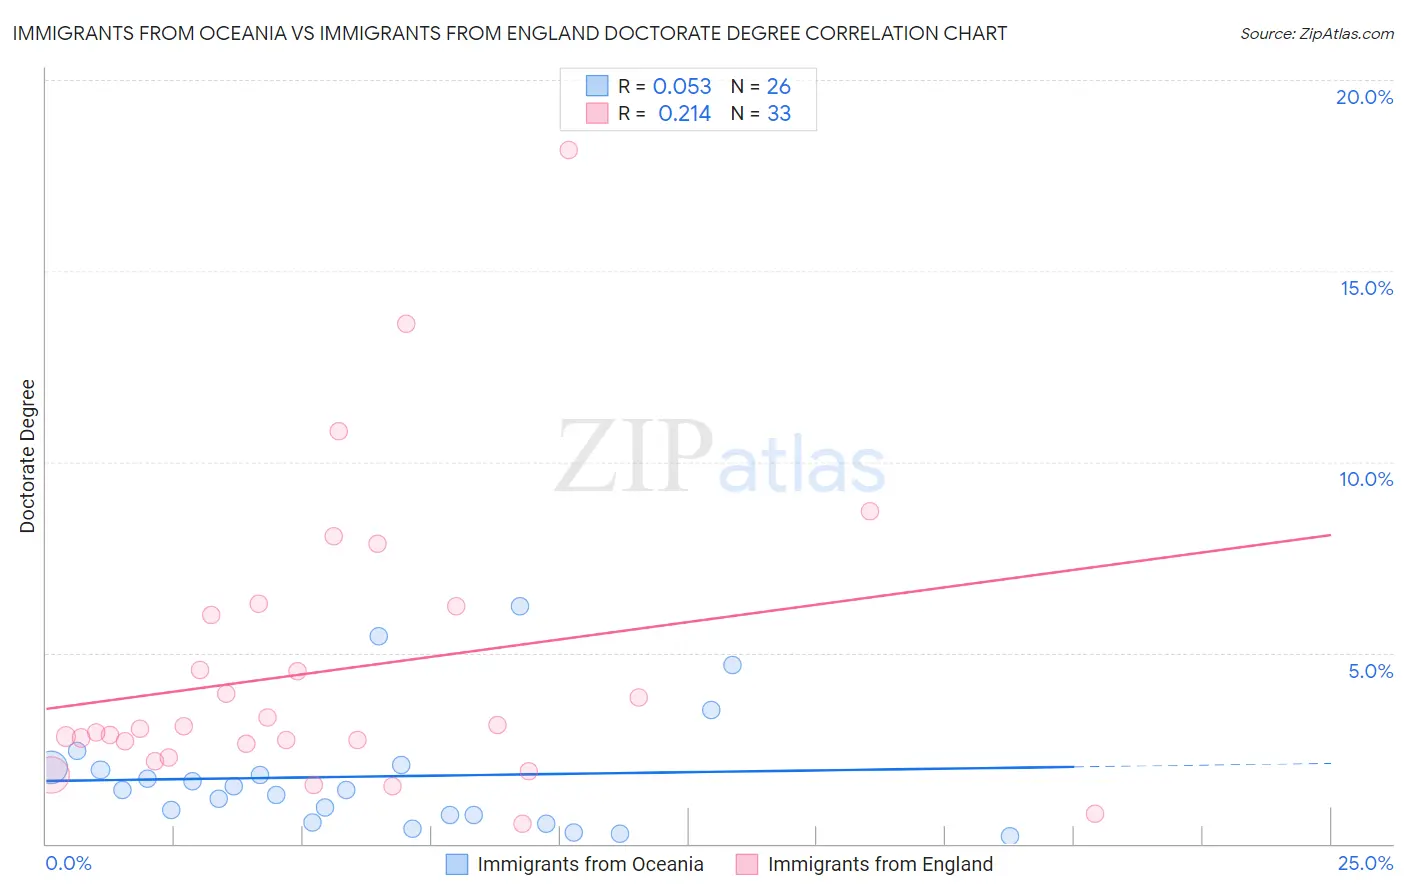
Immigrants from Oceania vs Immigrants from England Doctorate Degree Correlation Chart
The statistical analysis conducted on geographies consisting of 303,370,290 people shows a slight positive correlation between the proportion of Immigrants from Oceania and percentage of population with at least doctorate degree education in the United States with a correlation coefficient (R) of 0.053 and weighted average of 1.9%. Similarly, the statistical analysis conducted on geographies consisting of 388,548,002 people shows a weak positive correlation between the proportion of Immigrants from England and percentage of population with at least doctorate degree education in the United States with a correlation coefficient (R) of 0.214 and weighted average of 2.2%, a difference of 15.5%.
Doctorate Degree Correlation Summary
| Measurement | Immigrants from Oceania | Immigrants from England |
| Minimum | 0.19% | 0.53% |
| Maximum | 6.2% | 18.2% |
| Range | 6.0% | 17.7% |
| Mean | 1.8% | 4.5% |
| Median | 1.4% | 3.0% |
| Interquartile 25% (IQ1) | 0.75% | 2.4% |
| Interquartile 75% (IQ3) | 2.0% | 6.1% |
| Interquartile Range (IQR) | 1.2% | 3.7% |
| Standard Deviation (Sample) | 1.6% | 3.8% |
| Standard Deviation (Population) | 1.5% | 3.8% |
Similar Demographics by Doctorate Degree
Demographics Similar to Immigrants from Oceania by Doctorate Degree
In terms of doctorate degree, the demographic groups most similar to Immigrants from Oceania are Immigrants from Kenya (1.9%, a difference of 0.050%), Albanian (1.9%, a difference of 0.15%), Immigrants from Albania (1.9%, a difference of 0.22%), Polish (1.9%, a difference of 0.24%), and Slavic (1.9%, a difference of 0.30%).
| Demographics | Rating | Rank | Doctorate Degree |
| Immigrants | Syria | 83.6 /100 | #146 | Excellent 1.9% |
| Immigrants | Senegal | 82.5 /100 | #147 | Excellent 1.9% |
| Luxembourgers | 81.1 /100 | #148 | Excellent 1.9% |
| Basques | 76.9 /100 | #149 | Good 1.9% |
| English | 75.9 /100 | #150 | Good 1.9% |
| Albanians | 74.8 /100 | #151 | Good 1.9% |
| Immigrants | Kenya | 74.3 /100 | #152 | Good 1.9% |
| Immigrants | Oceania | 74.0 /100 | #153 | Good 1.9% |
| Immigrants | Albania | 72.8 /100 | #154 | Good 1.9% |
| Poles | 72.7 /100 | #155 | Good 1.9% |
| Slavs | 72.4 /100 | #156 | Good 1.9% |
| Danes | 71.9 /100 | #157 | Good 1.9% |
| Hungarians | 71.7 /100 | #158 | Good 1.9% |
| Slovenes | 70.2 /100 | #159 | Good 1.9% |
| Welsh | 69.7 /100 | #160 | Good 1.9% |
Demographics Similar to Immigrants from England by Doctorate Degree
In terms of doctorate degree, the demographic groups most similar to Immigrants from England are Immigrants from Brazil (2.2%, a difference of 0.13%), Immigrants from Lithuania (2.2%, a difference of 0.14%), Immigrants from Uganda (2.2%, a difference of 0.32%), Egyptian (2.2%, a difference of 0.83%), and Immigrants from Argentina (2.2%, a difference of 0.86%).
| Demographics | Rating | Rank | Doctorate Degree |
| Immigrants | Lebanon | 99.8 /100 | #77 | Exceptional 2.2% |
| Immigrants | Belarus | 99.7 /100 | #78 | Exceptional 2.2% |
| Northern Europeans | 99.7 /100 | #79 | Exceptional 2.2% |
| Ugandans | 99.7 /100 | #80 | Exceptional 2.2% |
| Immigrants | Argentina | 99.7 /100 | #81 | Exceptional 2.2% |
| Immigrants | Uganda | 99.6 /100 | #82 | Exceptional 2.2% |
| Immigrants | Lithuania | 99.6 /100 | #83 | Exceptional 2.2% |
| Immigrants | England | 99.6 /100 | #84 | Exceptional 2.2% |
| Immigrants | Brazil | 99.6 /100 | #85 | Exceptional 2.2% |
| Egyptians | 99.4 /100 | #86 | Exceptional 2.2% |
| Immigrants | Zimbabwe | 99.4 /100 | #87 | Exceptional 2.2% |
| Immigrants | Nepal | 99.3 /100 | #88 | Exceptional 2.2% |
| British | 99.3 /100 | #89 | Exceptional 2.2% |
| Immigrants | Scotland | 99.2 /100 | #90 | Exceptional 2.2% |
| Immigrants | Sudan | 99.1 /100 | #91 | Exceptional 2.2% |