Immigrants from Europe vs Comanche 3rd Grade
COMPARE
Immigrants from Europe
Comanche
3rd Grade
3rd Grade Comparison
Immigrants from Europe
Comanche
98.0%
3RD GRADE
91.2/ 100
METRIC RATING
130th/ 347
METRIC RANK
97.8%
3RD GRADE
53.8/ 100
METRIC RATING
169th/ 347
METRIC RANK
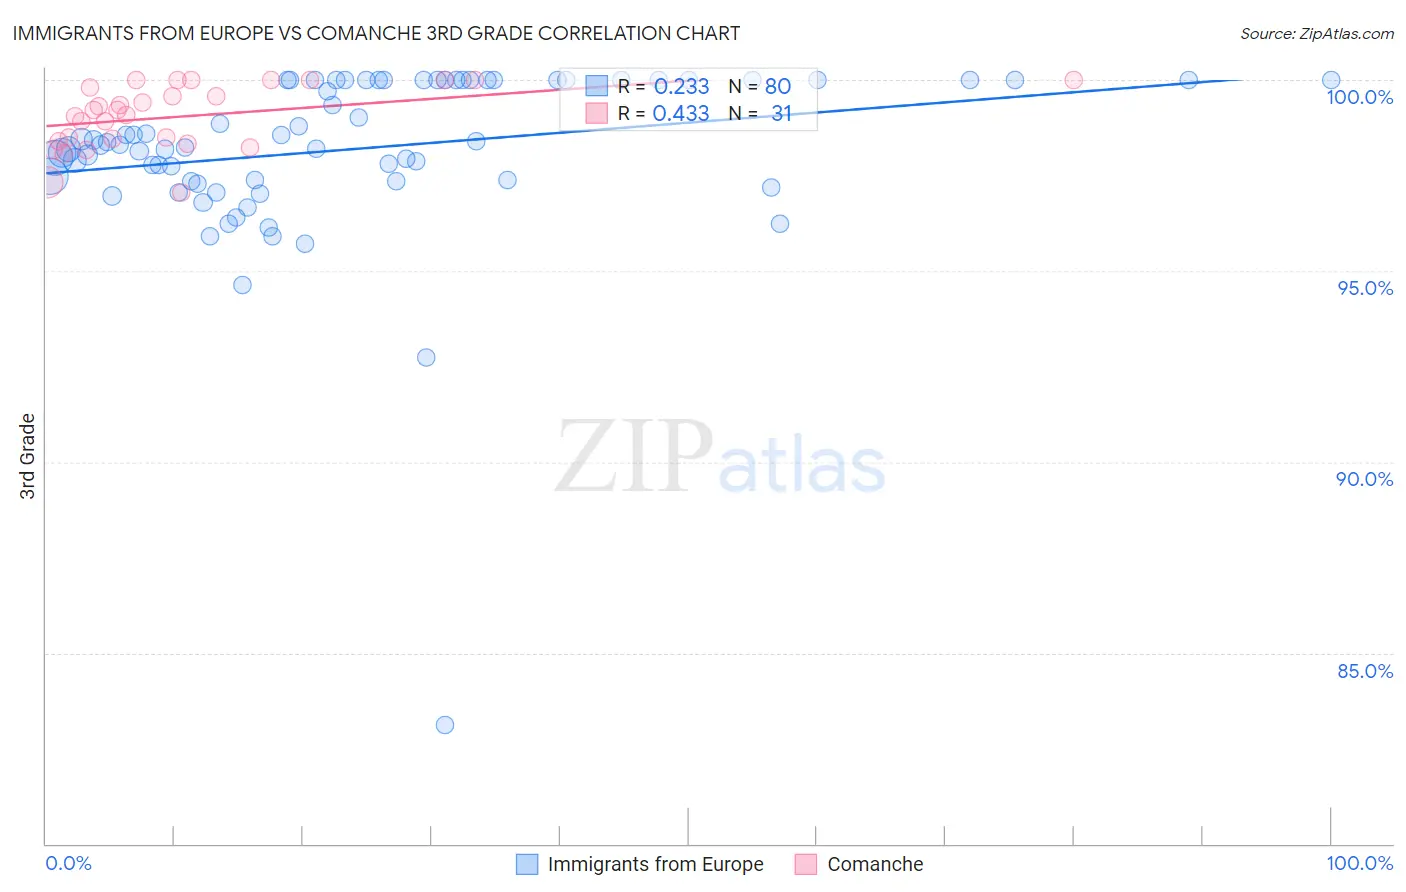
Immigrants from Europe vs Comanche 3rd Grade Correlation Chart
The statistical analysis conducted on geographies consisting of 547,425,973 people shows a weak positive correlation between the proportion of Immigrants from Europe and percentage of population with at least 3rd grade education in the United States with a correlation coefficient (R) of 0.233 and weighted average of 98.0%. Similarly, the statistical analysis conducted on geographies consisting of 109,786,530 people shows a moderate positive correlation between the proportion of Comanche and percentage of population with at least 3rd grade education in the United States with a correlation coefficient (R) of 0.433 and weighted average of 97.8%, a difference of 0.18%.
3rd Grade Correlation Summary
| Measurement | Immigrants from Europe | Comanche |
| Minimum | 83.1% | 97.1% |
| Maximum | 100.0% | 100.0% |
| Range | 16.9% | 2.9% |
| Mean | 98.2% | 99.1% |
| Median | 98.3% | 99.2% |
| Interquartile 25% (IQ1) | 97.4% | 98.4% |
| Interquartile 75% (IQ3) | 100.0% | 100.0% |
| Interquartile Range (IQR) | 2.6% | 1.6% |
| Standard Deviation (Sample) | 2.3% | 0.83% |
| Standard Deviation (Population) | 2.3% | 0.82% |
Similar Demographics by 3rd Grade
Demographics Similar to Immigrants from Europe by 3rd Grade
In terms of 3rd grade, the demographic groups most similar to Immigrants from Europe are Colville (98.0%, a difference of 0.010%), Immigrants from Serbia (98.0%, a difference of 0.010%), Ute (98.0%, a difference of 0.020%), Immigrants from Bulgaria (97.9%, a difference of 0.020%), and Immigrants from Hungary (97.9%, a difference of 0.020%).
| Demographics | Rating | Rank | 3rd Grade |
| Syrians | 93.8 /100 | #123 | Exceptional 98.0% |
| Immigrants | Japan | 93.7 /100 | #124 | Exceptional 98.0% |
| Immigrants | Saudi Arabia | 93.5 /100 | #125 | Exceptional 98.0% |
| Immigrants | Zimbabwe | 93.4 /100 | #126 | Exceptional 98.0% |
| Ute | 93.2 /100 | #127 | Exceptional 98.0% |
| Colville | 92.1 /100 | #128 | Exceptional 98.0% |
| Immigrants | Serbia | 91.9 /100 | #129 | Exceptional 98.0% |
| Immigrants | Europe | 91.2 /100 | #130 | Exceptional 98.0% |
| Immigrants | Bulgaria | 89.1 /100 | #131 | Excellent 97.9% |
| Immigrants | Hungary | 88.8 /100 | #132 | Excellent 97.9% |
| Immigrants | Kuwait | 88.7 /100 | #133 | Excellent 97.9% |
| Seminole | 88.7 /100 | #134 | Excellent 97.9% |
| Cambodians | 88.1 /100 | #135 | Excellent 97.9% |
| Spaniards | 87.9 /100 | #136 | Excellent 97.9% |
| Immigrants | Romania | 87.9 /100 | #137 | Excellent 97.9% |
Demographics Similar to Comanche by 3rd Grade
In terms of 3rd grade, the demographic groups most similar to Comanche are Immigrants from Spain (97.8%, a difference of 0.0%), Brazilian (97.8%, a difference of 0.0%), Immigrants from Jordan (97.8%, a difference of 0.010%), Marshallese (97.8%, a difference of 0.010%), and Immigrants from Bosnia and Herzegovina (97.8%, a difference of 0.010%).
| Demographics | Rating | Rank | 3rd Grade |
| Immigrants | Jordan | 57.9 /100 | #162 | Average 97.8% |
| Marshallese | 57.2 /100 | #163 | Average 97.8% |
| Immigrants | Bosnia and Herzegovina | 56.2 /100 | #164 | Average 97.8% |
| Ugandans | 56.1 /100 | #165 | Average 97.8% |
| Dutch West Indians | 55.5 /100 | #166 | Average 97.8% |
| Chileans | 55.3 /100 | #167 | Average 97.8% |
| Immigrants | Spain | 54.3 /100 | #168 | Average 97.8% |
| Comanche | 53.8 /100 | #169 | Average 97.8% |
| Brazilians | 53.7 /100 | #170 | Average 97.8% |
| Kenyans | 51.8 /100 | #171 | Average 97.8% |
| Spanish Americans | 51.8 /100 | #172 | Average 97.8% |
| Immigrants | Korea | 50.9 /100 | #173 | Average 97.8% |
| Navajo | 50.0 /100 | #174 | Average 97.8% |
| Immigrants | Micronesia | 47.6 /100 | #175 | Average 97.8% |
| Immigrants | Poland | 47.1 /100 | #176 | Average 97.8% |