Immigrants from North America vs Immigrants from Northern Europe 4th Grade
COMPARE
Immigrants from North America
Immigrants from Northern Europe
4th Grade
4th Grade Comparison
Immigrants from North America
Immigrants from Northern Europe
98.1%
4TH GRADE
99.7/ 100
METRIC RATING
61st/ 347
METRIC RANK
98.0%
4TH GRADE
99.6/ 100
METRIC RATING
65th/ 347
METRIC RANK
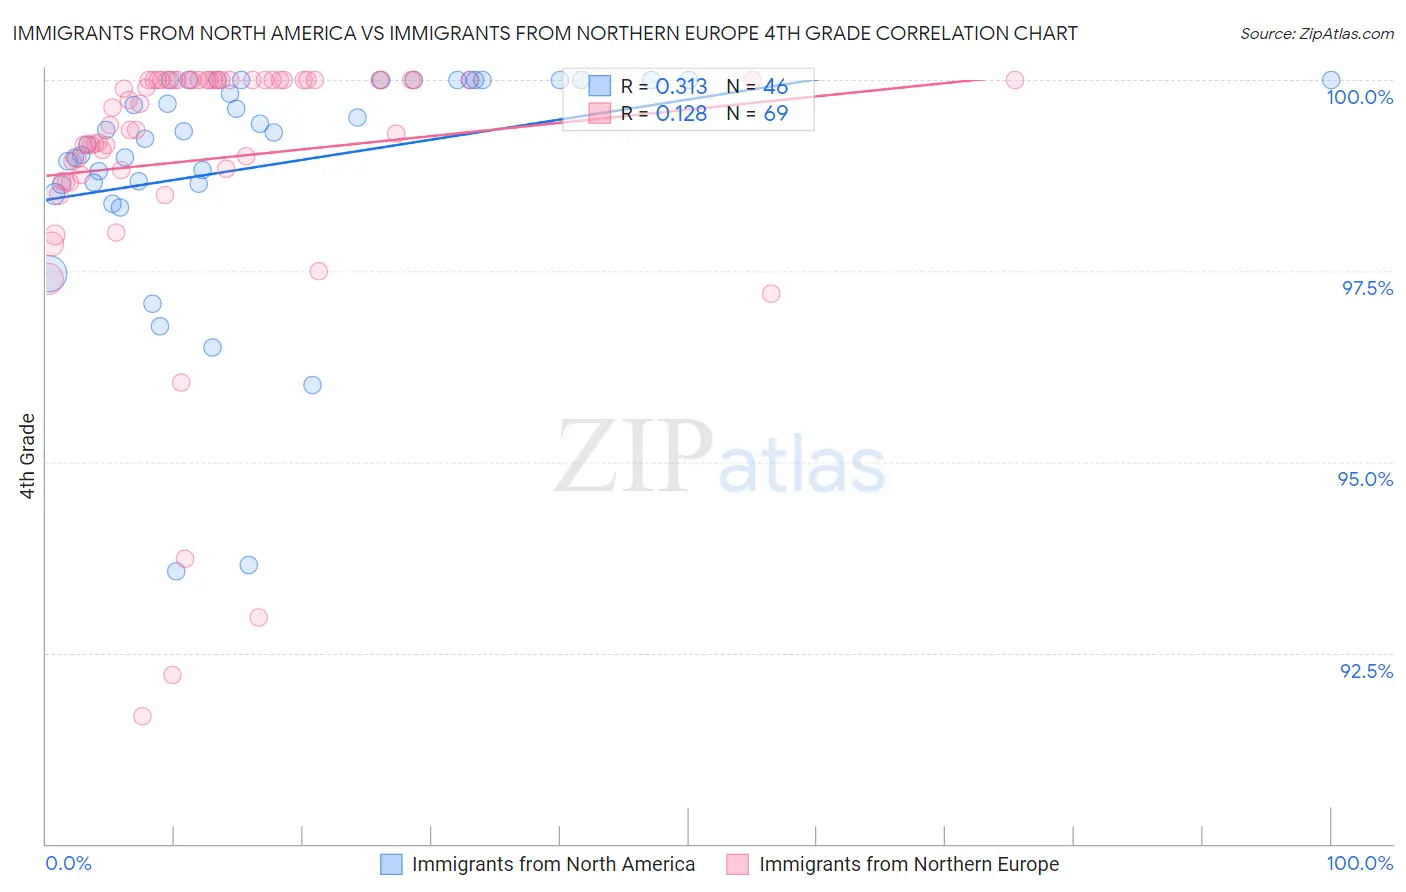
Immigrants from North America vs Immigrants from Northern Europe 4th Grade Correlation Chart
The statistical analysis conducted on geographies consisting of 462,462,400 people shows a mild positive correlation between the proportion of Immigrants from North America and percentage of population with at least 4th grade education in the United States with a correlation coefficient (R) of 0.313 and weighted average of 98.1%. Similarly, the statistical analysis conducted on geographies consisting of 477,226,800 people shows a poor positive correlation between the proportion of Immigrants from Northern Europe and percentage of population with at least 4th grade education in the United States with a correlation coefficient (R) of 0.128 and weighted average of 98.0%, a difference of 0.020%.
4th Grade Correlation Summary
| Measurement | Immigrants from North America | Immigrants from Northern Europe |
| Minimum | 93.6% | 91.7% |
| Maximum | 100.0% | 100.0% |
| Range | 6.4% | 8.3% |
| Mean | 98.9% | 99.0% |
| Median | 99.3% | 99.7% |
| Interquartile 25% (IQ1) | 98.6% | 98.8% |
| Interquartile 75% (IQ3) | 100.0% | 100.0% |
| Interquartile Range (IQR) | 1.4% | 1.2% |
| Standard Deviation (Sample) | 1.5% | 1.8% |
| Standard Deviation (Population) | 1.5% | 1.8% |
Demographics Similar to Immigrants from North America and Immigrants from Northern Europe by 4th Grade
In terms of 4th grade, the demographic groups most similar to Immigrants from North America are Serbian (98.1%, a difference of 0.0%), Immigrants from Canada (98.1%, a difference of 0.010%), Russian (98.0%, a difference of 0.010%), American (98.1%, a difference of 0.020%), and Cajun (98.0%, a difference of 0.020%). Similarly, the demographic groups most similar to Immigrants from Northern Europe are Cajun (98.0%, a difference of 0.0%), Canadian (98.0%, a difference of 0.0%), New Zealander (98.0%, a difference of 0.0%), Russian (98.0%, a difference of 0.010%), and Kiowa (98.0%, a difference of 0.010%).
| Demographics | Rating | Rank | 4th Grade |
| Slavs | 99.8 /100 | #53 | Exceptional 98.1% |
| Maltese | 99.8 /100 | #54 | Exceptional 98.1% |
| Whites/Caucasians | 99.8 /100 | #55 | Exceptional 98.1% |
| Greeks | 99.8 /100 | #56 | Exceptional 98.1% |
| Austrians | 99.8 /100 | #57 | Exceptional 98.1% |
| Creek | 99.8 /100 | #58 | Exceptional 98.1% |
| Americans | 99.8 /100 | #59 | Exceptional 98.1% |
| Immigrants | Canada | 99.7 /100 | #60 | Exceptional 98.1% |
| Immigrants | North America | 99.7 /100 | #61 | Exceptional 98.1% |
| Serbians | 99.7 /100 | #62 | Exceptional 98.1% |
| Russians | 99.7 /100 | #63 | Exceptional 98.0% |
| Cajuns | 99.7 /100 | #64 | Exceptional 98.0% |
| Immigrants | Northern Europe | 99.6 /100 | #65 | Exceptional 98.0% |
| Canadians | 99.6 /100 | #66 | Exceptional 98.0% |
| New Zealanders | 99.6 /100 | #67 | Exceptional 98.0% |
| Kiowa | 99.6 /100 | #68 | Exceptional 98.0% |
| Pueblo | 99.6 /100 | #69 | Exceptional 98.0% |
| Immigrants | Austria | 99.6 /100 | #70 | Exceptional 98.0% |
| Lumbee | 99.6 /100 | #71 | Exceptional 98.0% |
| Iranians | 99.4 /100 | #72 | Exceptional 98.0% |
| Macedonians | 99.4 /100 | #73 | Exceptional 98.0% |