Guatemalan vs Hawaiian 6th Grade
COMPARE
Guatemalan
Hawaiian
6th Grade
6th Grade Comparison
Guatemalans
Hawaiians
94.2%
6TH GRADE
0.0/ 100
METRIC RATING
340th/ 347
METRIC RANK
96.9%
6TH GRADE
27.0/ 100
METRIC RATING
192nd/ 347
METRIC RANK
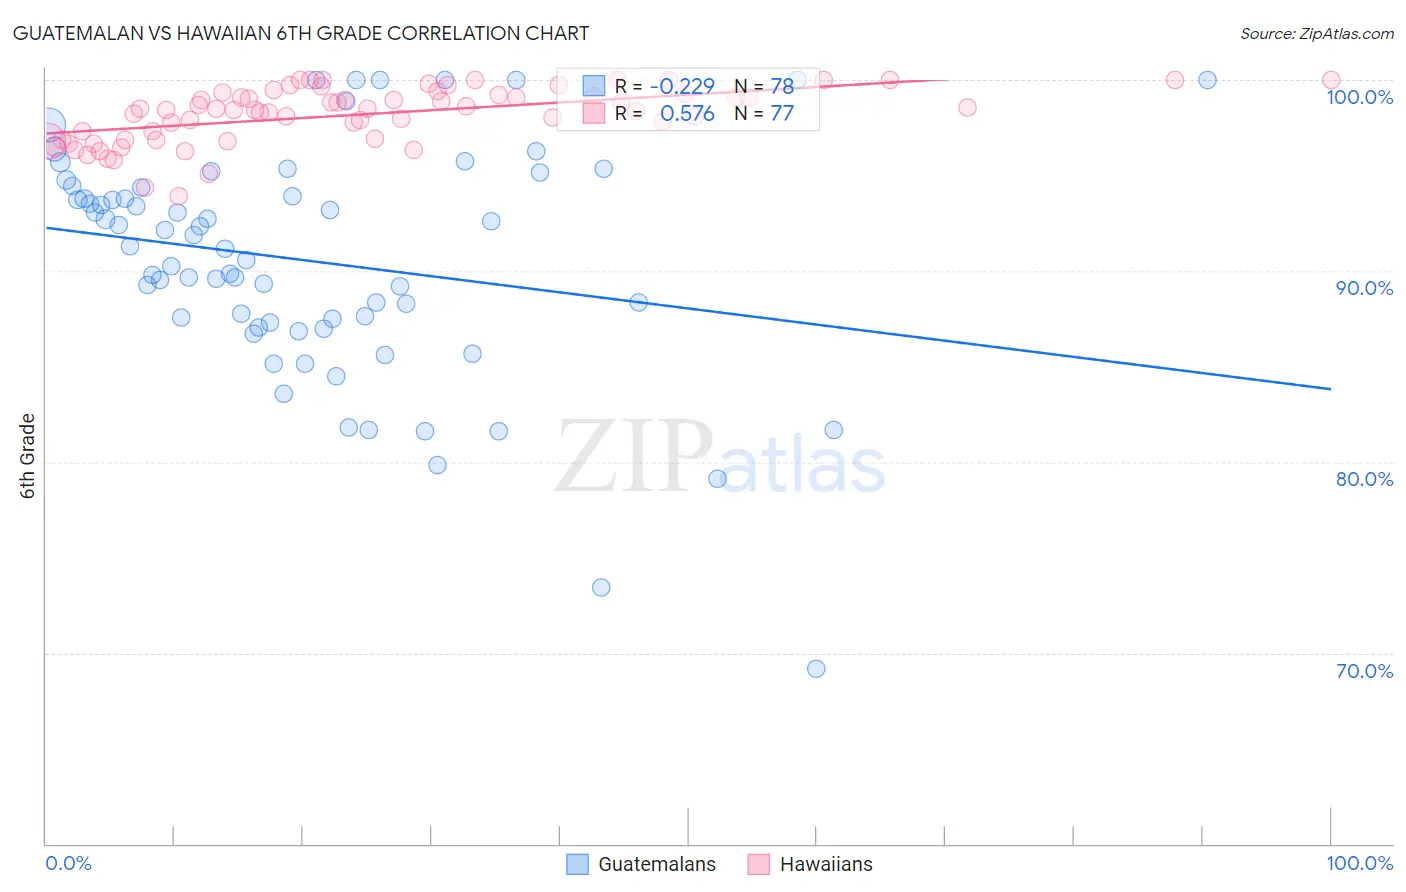
Guatemalan vs Hawaiian 6th Grade Correlation Chart
The statistical analysis conducted on geographies consisting of 409,566,469 people shows a weak negative correlation between the proportion of Guatemalans and percentage of population with at least 6th grade education in the United States with a correlation coefficient (R) of -0.229 and weighted average of 94.2%. Similarly, the statistical analysis conducted on geographies consisting of 327,621,279 people shows a substantial positive correlation between the proportion of Hawaiians and percentage of population with at least 6th grade education in the United States with a correlation coefficient (R) of 0.576 and weighted average of 96.9%, a difference of 2.9%.
6th Grade Correlation Summary
| Measurement | Guatemalan | Hawaiian |
| Minimum | 69.2% | 93.9% |
| Maximum | 100.0% | 100.0% |
| Range | 30.8% | 6.1% |
| Mean | 90.5% | 98.2% |
| Median | 91.2% | 98.5% |
| Interquartile 25% (IQ1) | 87.3% | 96.9% |
| Interquartile 75% (IQ3) | 94.4% | 99.3% |
| Interquartile Range (IQR) | 7.1% | 2.4% |
| Standard Deviation (Sample) | 6.1% | 1.4% |
| Standard Deviation (Population) | 6.0% | 1.4% |
Similar Demographics by 6th Grade
Demographics Similar to Guatemalans by 6th Grade
In terms of 6th grade, the demographic groups most similar to Guatemalans are Yakama (94.3%, a difference of 0.11%), Immigrants from Yemen (94.1%, a difference of 0.11%), Immigrants from Central America (94.0%, a difference of 0.22%), Central American (94.5%, a difference of 0.26%), and Immigrants from Cabo Verde (94.4%, a difference of 0.26%).
| Demographics | Rating | Rank | 6th Grade |
| Immigrants | Latin America | 0.0 /100 | #333 | Tragic 94.7% |
| Immigrants | Azores | 0.0 /100 | #334 | Tragic 94.7% |
| Mexicans | 0.0 /100 | #335 | Tragic 94.6% |
| Immigrants | Dominican Republic | 0.0 /100 | #336 | Tragic 94.6% |
| Central Americans | 0.0 /100 | #337 | Tragic 94.5% |
| Immigrants | Cabo Verde | 0.0 /100 | #338 | Tragic 94.4% |
| Yakama | 0.0 /100 | #339 | Tragic 94.3% |
| Guatemalans | 0.0 /100 | #340 | Tragic 94.2% |
| Immigrants | Yemen | 0.0 /100 | #341 | Tragic 94.1% |
| Immigrants | Central America | 0.0 /100 | #342 | Tragic 94.0% |
| Immigrants | Mexico | 0.0 /100 | #343 | Tragic 93.9% |
| Immigrants | Guatemala | 0.0 /100 | #344 | Tragic 93.9% |
| Salvadorans | 0.0 /100 | #345 | Tragic 93.9% |
| Spanish American Indians | 0.0 /100 | #346 | Tragic 93.6% |
| Immigrants | El Salvador | 0.0 /100 | #347 | Tragic 93.6% |
Demographics Similar to Hawaiians by 6th Grade
In terms of 6th grade, the demographic groups most similar to Hawaiians are Panamanian (96.9%, a difference of 0.0%), Paraguayan (96.9%, a difference of 0.0%), Dutch West Indian (96.9%, a difference of 0.010%), Immigrants from Lebanon (96.9%, a difference of 0.010%), and Immigrants from Brazil (96.9%, a difference of 0.010%).
| Demographics | Rating | Rank | 6th Grade |
| Argentineans | 33.0 /100 | #185 | Fair 97.0% |
| Immigrants | Egypt | 31.4 /100 | #186 | Fair 97.0% |
| Guamanians/Chamorros | 30.6 /100 | #187 | Fair 97.0% |
| Immigrants | Argentina | 30.4 /100 | #188 | Fair 97.0% |
| Blacks/African Americans | 30.2 /100 | #189 | Fair 97.0% |
| Dutch West Indians | 28.3 /100 | #190 | Fair 96.9% |
| Panamanians | 27.3 /100 | #191 | Fair 96.9% |
| Hawaiians | 27.0 /100 | #192 | Fair 96.9% |
| Paraguayans | 26.6 /100 | #193 | Fair 96.9% |
| Immigrants | Lebanon | 25.6 /100 | #194 | Fair 96.9% |
| Immigrants | Brazil | 25.5 /100 | #195 | Fair 96.9% |
| Immigrants | Uganda | 21.2 /100 | #196 | Fair 96.9% |
| Brazilians | 20.1 /100 | #197 | Fair 96.9% |
| Immigrants | Albania | 18.8 /100 | #198 | Poor 96.9% |
| Immigrants | Northern Africa | 15.7 /100 | #199 | Poor 96.9% |