Guamanian/Chamorro vs Immigrants from Dominica 8th Grade
COMPARE
Guamanian/Chamorro
Immigrants from Dominica
8th Grade
8th Grade Comparison
Guamanians/Chamorros
Immigrants from Dominica
95.6%
8TH GRADE
26.6/ 100
METRIC RATING
194th/ 347
METRIC RANK
94.0%
8TH GRADE
0.0/ 100
METRIC RATING
303rd/ 347
METRIC RANK
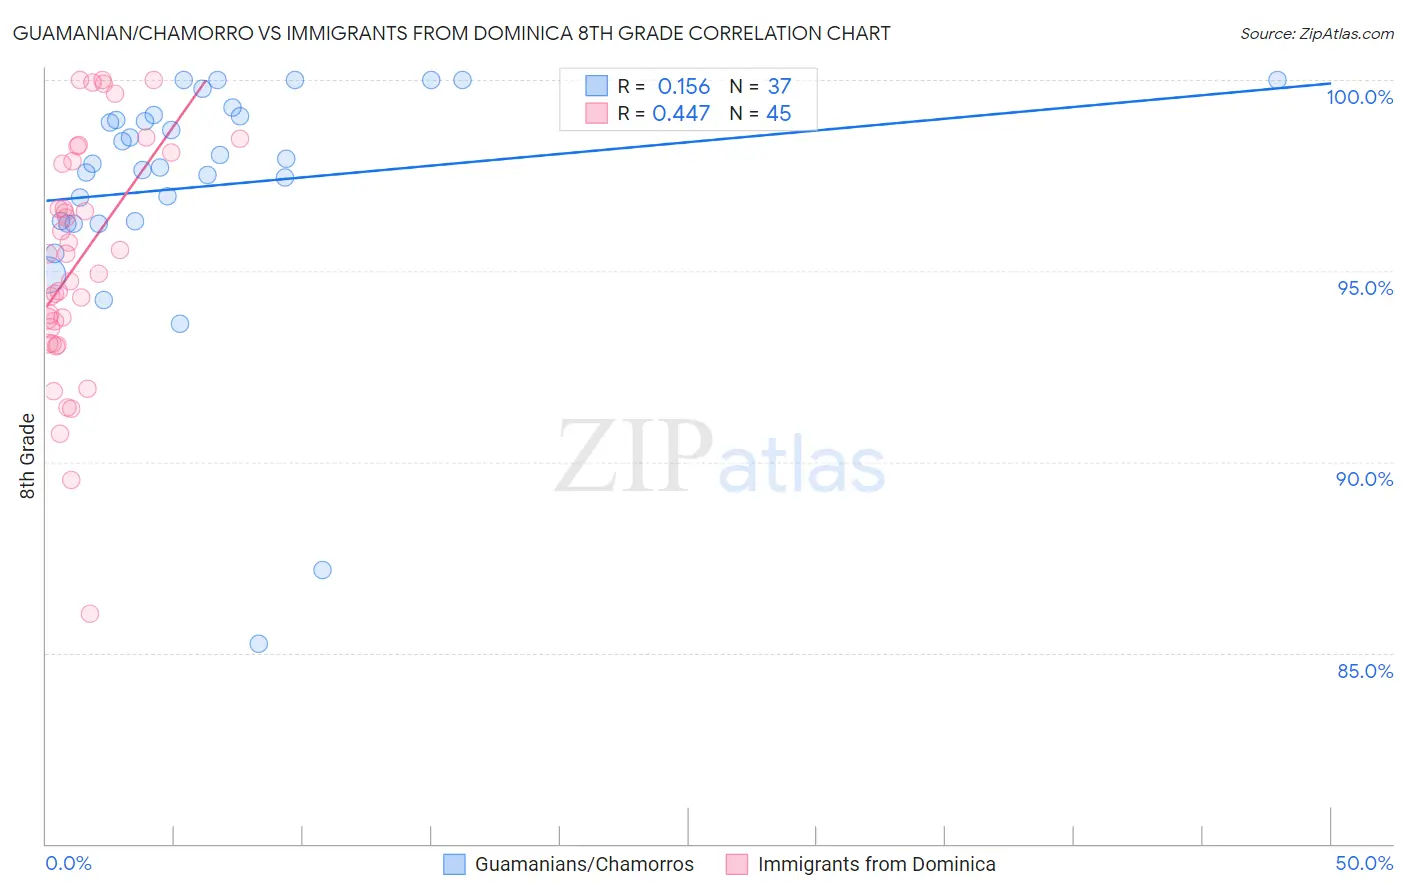
Guamanian/Chamorro vs Immigrants from Dominica 8th Grade Correlation Chart
The statistical analysis conducted on geographies consisting of 221,965,618 people shows a poor positive correlation between the proportion of Guamanians/Chamorros and percentage of population with at least 8th grade education in the United States with a correlation coefficient (R) of 0.156 and weighted average of 95.6%. Similarly, the statistical analysis conducted on geographies consisting of 83,794,115 people shows a moderate positive correlation between the proportion of Immigrants from Dominica and percentage of population with at least 8th grade education in the United States with a correlation coefficient (R) of 0.447 and weighted average of 94.0%, a difference of 1.7%.
8th Grade Correlation Summary
| Measurement | Guamanian/Chamorro | Immigrants from Dominica |
| Minimum | 85.2% | 86.0% |
| Maximum | 100.0% | 100.0% |
| Range | 14.8% | 14.0% |
| Mean | 97.2% | 95.3% |
| Median | 97.8% | 95.4% |
| Interquartile 25% (IQ1) | 96.3% | 93.3% |
| Interquartile 75% (IQ3) | 99.1% | 98.0% |
| Interquartile Range (IQR) | 2.8% | 4.7% |
| Standard Deviation (Sample) | 3.2% | 3.1% |
| Standard Deviation (Population) | 3.1% | 3.1% |
Similar Demographics by 8th Grade
Demographics Similar to Guamanians/Chamorros by 8th Grade
In terms of 8th grade, the demographic groups most similar to Guamanians/Chamorros are Panamanian (95.6%, a difference of 0.010%), Immigrants from Zaire (95.6%, a difference of 0.010%), Pima (95.6%, a difference of 0.020%), Assyrian/Chaldean/Syriac (95.6%, a difference of 0.020%), and Sierra Leonean (95.6%, a difference of 0.020%).
| Demographics | Rating | Rank | 8th Grade |
| Sudanese | 33.0 /100 | #187 | Fair 95.6% |
| Liberians | 32.4 /100 | #188 | Fair 95.6% |
| Immigrants | Micronesia | 31.6 /100 | #189 | Fair 95.6% |
| Immigrants | Venezuela | 30.8 /100 | #190 | Fair 95.6% |
| Immigrants | Nepal | 30.2 /100 | #191 | Fair 95.6% |
| Pima | 28.6 /100 | #192 | Fair 95.6% |
| Panamanians | 28.4 /100 | #193 | Fair 95.6% |
| Guamanians/Chamorros | 26.6 /100 | #194 | Fair 95.6% |
| Immigrants | Zaire | 25.2 /100 | #195 | Fair 95.6% |
| Assyrians/Chaldeans/Syriacs | 24.5 /100 | #196 | Fair 95.6% |
| Sierra Leoneans | 24.3 /100 | #197 | Fair 95.6% |
| Paraguayans | 22.6 /100 | #198 | Fair 95.5% |
| Immigrants | Northern Africa | 22.5 /100 | #199 | Fair 95.5% |
| Argentineans | 22.2 /100 | #200 | Fair 95.5% |
| Immigrants | Argentina | 20.6 /100 | #201 | Fair 95.5% |
Demographics Similar to Immigrants from Dominica by 8th Grade
In terms of 8th grade, the demographic groups most similar to Immigrants from Dominica are Sri Lankan (94.0%, a difference of 0.040%), Guyanese (93.9%, a difference of 0.080%), Immigrants from Haiti (93.9%, a difference of 0.12%), Immigrants from Laos (94.1%, a difference of 0.14%), and Immigrants from Burma/Myanmar (94.1%, a difference of 0.16%).
| Demographics | Rating | Rank | 8th Grade |
| Haitians | 0.0 /100 | #296 | Tragic 94.2% |
| Immigrants | South Eastern Asia | 0.0 /100 | #297 | Tragic 94.2% |
| Indonesians | 0.0 /100 | #298 | Tragic 94.1% |
| Cubans | 0.0 /100 | #299 | Tragic 94.1% |
| Immigrants | Burma/Myanmar | 0.0 /100 | #300 | Tragic 94.1% |
| Immigrants | Laos | 0.0 /100 | #301 | Tragic 94.1% |
| Sri Lankans | 0.0 /100 | #302 | Tragic 94.0% |
| Immigrants | Dominica | 0.0 /100 | #303 | Tragic 94.0% |
| Guyanese | 0.0 /100 | #304 | Tragic 93.9% |
| Immigrants | Haiti | 0.0 /100 | #305 | Tragic 93.9% |
| Immigrants | Guyana | 0.0 /100 | #306 | Tragic 93.8% |
| Immigrants | Portugal | 0.0 /100 | #307 | Tragic 93.8% |
| Ecuadorians | 0.0 /100 | #308 | Tragic 93.6% |
| Immigrants | Immigrants | 0.0 /100 | #309 | Tragic 93.6% |
| Japanese | 0.0 /100 | #310 | Tragic 93.6% |