Immigrants from Pakistan vs Immigrants from Dominica 8th Grade
COMPARE
Immigrants from Pakistan
Immigrants from Dominica
8th Grade
8th Grade Comparison
Immigrants from Pakistan
Immigrants from Dominica
95.4%
8TH GRADE
9.7/ 100
METRIC RATING
212th/ 347
METRIC RANK
94.0%
8TH GRADE
0.0/ 100
METRIC RATING
303rd/ 347
METRIC RANK
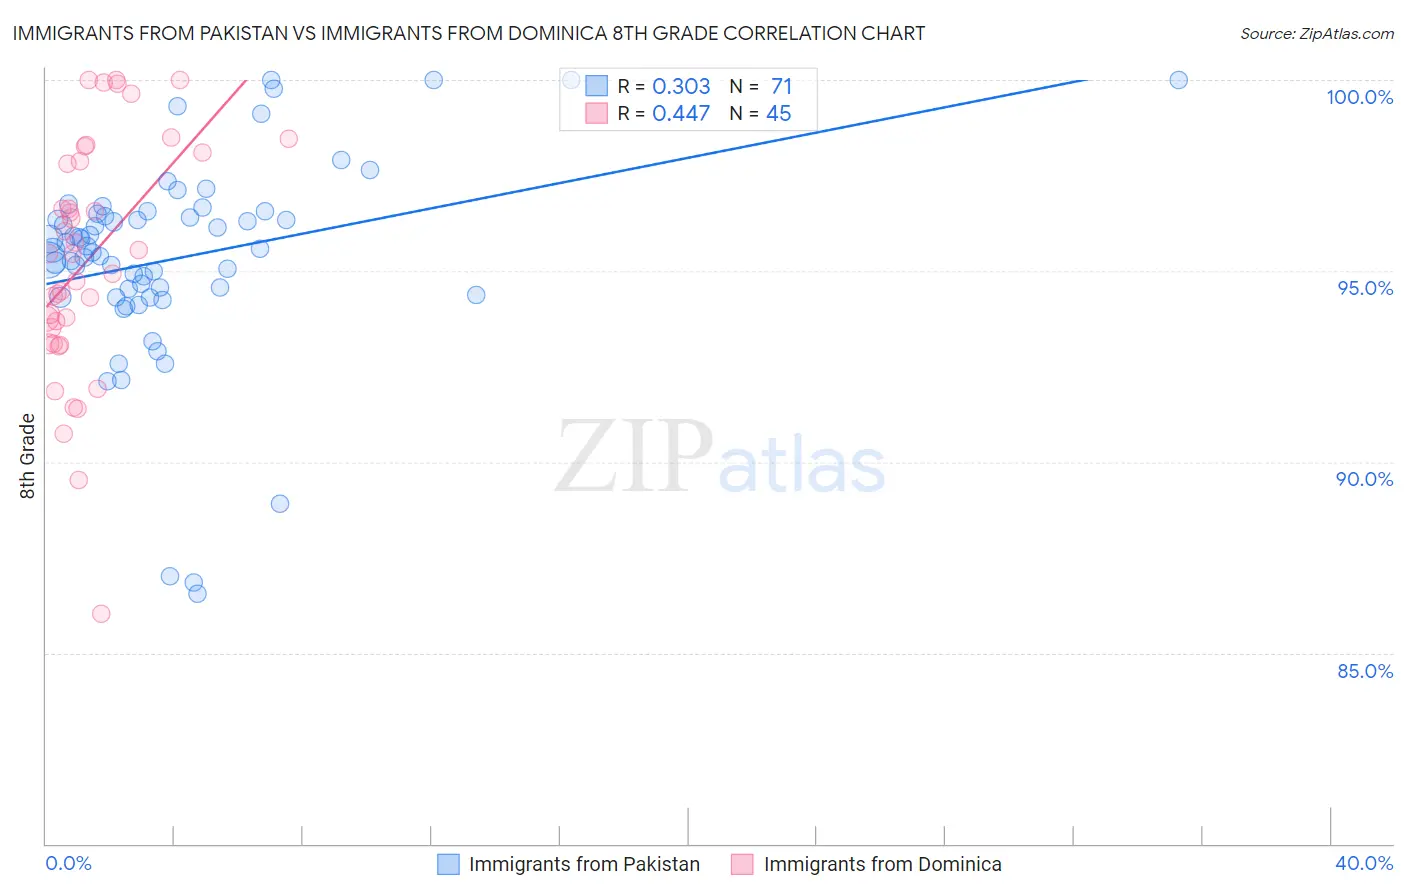
Immigrants from Pakistan vs Immigrants from Dominica 8th Grade Correlation Chart
The statistical analysis conducted on geographies consisting of 283,836,178 people shows a mild positive correlation between the proportion of Immigrants from Pakistan and percentage of population with at least 8th grade education in the United States with a correlation coefficient (R) of 0.303 and weighted average of 95.4%. Similarly, the statistical analysis conducted on geographies consisting of 83,794,115 people shows a moderate positive correlation between the proportion of Immigrants from Dominica and percentage of population with at least 8th grade education in the United States with a correlation coefficient (R) of 0.447 and weighted average of 94.0%, a difference of 1.5%.
8th Grade Correlation Summary
| Measurement | Immigrants from Pakistan | Immigrants from Dominica |
| Minimum | 86.5% | 86.0% |
| Maximum | 100.0% | 100.0% |
| Range | 13.5% | 14.0% |
| Mean | 95.3% | 95.3% |
| Median | 95.6% | 95.4% |
| Interquartile 25% (IQ1) | 94.4% | 93.3% |
| Interquartile 75% (IQ3) | 96.5% | 98.0% |
| Interquartile Range (IQR) | 2.1% | 4.7% |
| Standard Deviation (Sample) | 2.7% | 3.1% |
| Standard Deviation (Population) | 2.7% | 3.1% |
Similar Demographics by 8th Grade
Demographics Similar to Immigrants from Pakistan by 8th Grade
In terms of 8th grade, the demographic groups most similar to Immigrants from Pakistan are Laotian (95.4%, a difference of 0.010%), Immigrants from Chile (95.4%, a difference of 0.010%), Immigrants from Liberia (95.4%, a difference of 0.010%), Samoan (95.4%, a difference of 0.030%), and Immigrants from Eastern Asia (95.4%, a difference of 0.030%).
| Demographics | Rating | Rank | 8th Grade |
| Immigrants | Bahamas | 16.7 /100 | #205 | Poor 95.5% |
| Comanche | 16.3 /100 | #206 | Poor 95.5% |
| Immigrants | Sudan | 15.1 /100 | #207 | Poor 95.5% |
| Portuguese | 14.3 /100 | #208 | Poor 95.5% |
| Immigrants | Lebanon | 13.7 /100 | #209 | Poor 95.4% |
| Africans | 13.6 /100 | #210 | Poor 95.4% |
| Immigrants | Morocco | 12.4 /100 | #211 | Poor 95.4% |
| Immigrants | Pakistan | 9.7 /100 | #212 | Tragic 95.4% |
| Laotians | 9.0 /100 | #213 | Tragic 95.4% |
| Immigrants | Chile | 9.0 /100 | #214 | Tragic 95.4% |
| Immigrants | Liberia | 8.9 /100 | #215 | Tragic 95.4% |
| Samoans | 8.4 /100 | #216 | Tragic 95.4% |
| Immigrants | Eastern Asia | 8.3 /100 | #217 | Tragic 95.4% |
| Dutch West Indians | 8.1 /100 | #218 | Tragic 95.4% |
| Spanish Americans | 8.0 /100 | #219 | Tragic 95.4% |
Demographics Similar to Immigrants from Dominica by 8th Grade
In terms of 8th grade, the demographic groups most similar to Immigrants from Dominica are Sri Lankan (94.0%, a difference of 0.040%), Guyanese (93.9%, a difference of 0.080%), Immigrants from Haiti (93.9%, a difference of 0.12%), Immigrants from Laos (94.1%, a difference of 0.14%), and Immigrants from Burma/Myanmar (94.1%, a difference of 0.16%).
| Demographics | Rating | Rank | 8th Grade |
| Haitians | 0.0 /100 | #296 | Tragic 94.2% |
| Immigrants | South Eastern Asia | 0.0 /100 | #297 | Tragic 94.2% |
| Indonesians | 0.0 /100 | #298 | Tragic 94.1% |
| Cubans | 0.0 /100 | #299 | Tragic 94.1% |
| Immigrants | Burma/Myanmar | 0.0 /100 | #300 | Tragic 94.1% |
| Immigrants | Laos | 0.0 /100 | #301 | Tragic 94.1% |
| Sri Lankans | 0.0 /100 | #302 | Tragic 94.0% |
| Immigrants | Dominica | 0.0 /100 | #303 | Tragic 94.0% |
| Guyanese | 0.0 /100 | #304 | Tragic 93.9% |
| Immigrants | Haiti | 0.0 /100 | #305 | Tragic 93.9% |
| Immigrants | Guyana | 0.0 /100 | #306 | Tragic 93.8% |
| Immigrants | Portugal | 0.0 /100 | #307 | Tragic 93.8% |
| Ecuadorians | 0.0 /100 | #308 | Tragic 93.6% |
| Immigrants | Immigrants | 0.0 /100 | #309 | Tragic 93.6% |
| Japanese | 0.0 /100 | #310 | Tragic 93.6% |