Northern European vs West Indian 1st Grade
COMPARE
Northern European
West Indian
1st Grade
1st Grade Comparison
Northern Europeans
West Indians
98.5%
1ST GRADE
99.9/ 100
METRIC RATING
44th/ 347
METRIC RANK
97.5%
1ST GRADE
0.3/ 100
METRIC RATING
269th/ 347
METRIC RANK
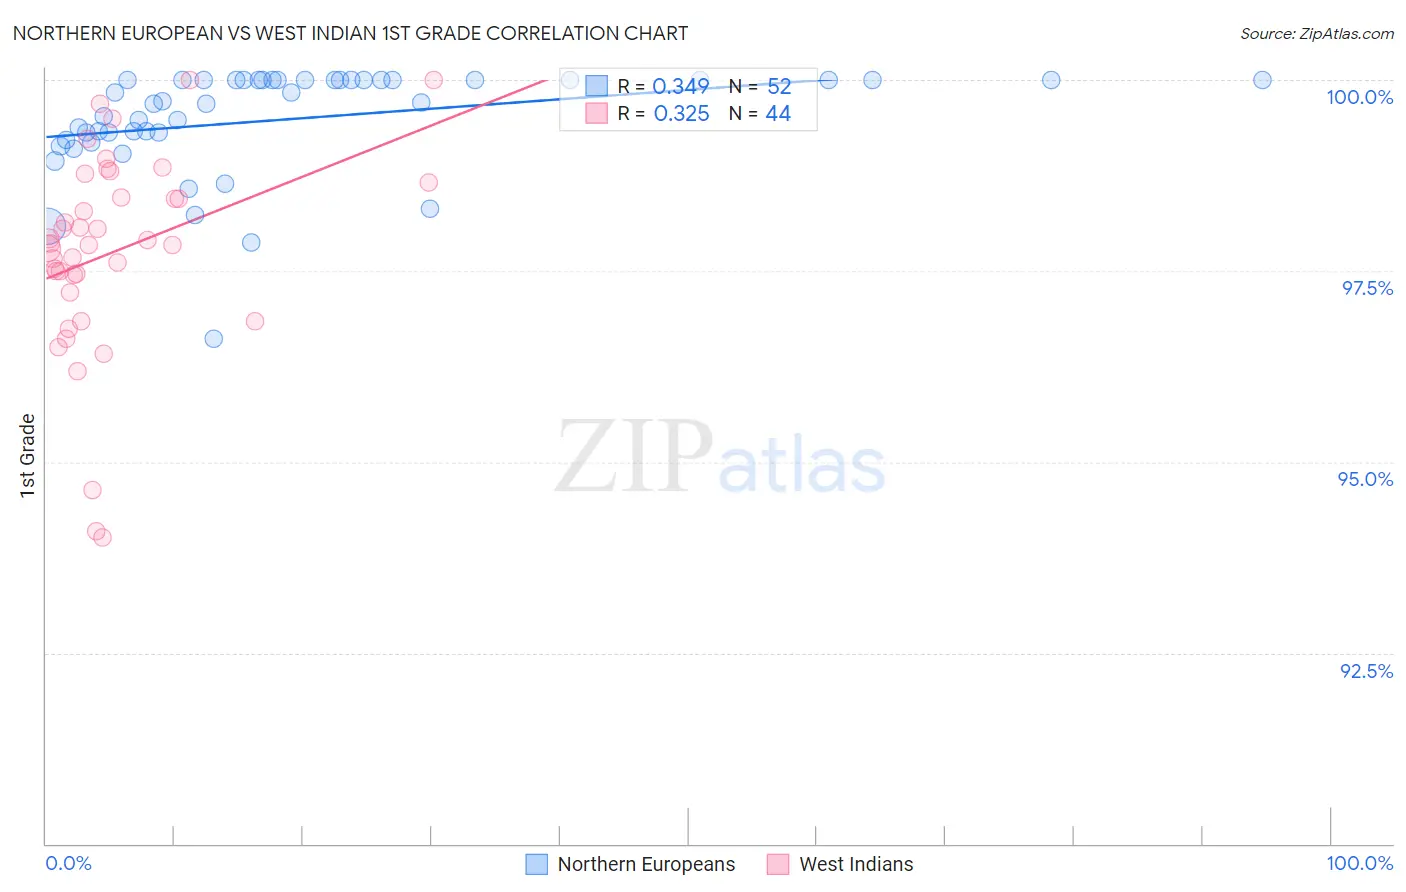
Northern European vs West Indian 1st Grade Correlation Chart
The statistical analysis conducted on geographies consisting of 406,093,361 people shows a mild positive correlation between the proportion of Northern Europeans and percentage of population with at least 1st grade education in the United States with a correlation coefficient (R) of 0.349 and weighted average of 98.5%. Similarly, the statistical analysis conducted on geographies consisting of 254,063,654 people shows a mild positive correlation between the proportion of West Indians and percentage of population with at least 1st grade education in the United States with a correlation coefficient (R) of 0.325 and weighted average of 97.5%, a difference of 1.0%.
1st Grade Correlation Summary
| Measurement | Northern European | West Indian |
| Minimum | 96.6% | 94.0% |
| Maximum | 100.0% | 100.0% |
| Range | 3.4% | 6.0% |
| Mean | 99.5% | 97.7% |
| Median | 99.7% | 97.9% |
| Interquartile 25% (IQ1) | 99.3% | 97.3% |
| Interquartile 75% (IQ3) | 100.0% | 98.6% |
| Interquartile Range (IQR) | 0.74% | 1.2% |
| Standard Deviation (Sample) | 0.70% | 1.3% |
| Standard Deviation (Population) | 0.69% | 1.3% |
Similar Demographics by 1st Grade
Demographics Similar to Northern Europeans by 1st Grade
In terms of 1st grade, the demographic groups most similar to Northern Europeans are Lumbee (98.5%, a difference of 0.0%), Belgian (98.4%, a difference of 0.0%), Luxembourger (98.5%, a difference of 0.010%), Eastern European (98.5%, a difference of 0.010%), and Native Hawaiian (98.5%, a difference of 0.010%).
| Demographics | Rating | Rank | 1st Grade |
| Italians | 99.9 /100 | #37 | Exceptional 98.5% |
| Chippewa | 99.9 /100 | #38 | Exceptional 98.5% |
| Latvians | 99.9 /100 | #39 | Exceptional 98.5% |
| Luxembourgers | 99.9 /100 | #40 | Exceptional 98.5% |
| Eastern Europeans | 99.9 /100 | #41 | Exceptional 98.5% |
| Native Hawaiians | 99.9 /100 | #42 | Exceptional 98.5% |
| Lumbee | 99.9 /100 | #43 | Exceptional 98.5% |
| Northern Europeans | 99.9 /100 | #44 | Exceptional 98.5% |
| Belgians | 99.9 /100 | #45 | Exceptional 98.4% |
| Hungarians | 99.9 /100 | #46 | Exceptional 98.4% |
| Ottawa | 99.8 /100 | #47 | Exceptional 98.4% |
| Czechoslovakians | 99.8 /100 | #48 | Exceptional 98.4% |
| Celtics | 99.8 /100 | #49 | Exceptional 98.4% |
| Whites/Caucasians | 99.8 /100 | #50 | Exceptional 98.4% |
| Estonians | 99.8 /100 | #51 | Exceptional 98.4% |
Demographics Similar to West Indians by 1st Grade
In terms of 1st grade, the demographic groups most similar to West Indians are Immigrants from Sierra Leone (97.5%, a difference of 0.010%), Immigrants from Nigeria (97.5%, a difference of 0.010%), Cuban (97.5%, a difference of 0.020%), Immigrants from Liberia (97.5%, a difference of 0.020%), and Immigrants from Jamaica (97.5%, a difference of 0.020%).
| Demographics | Rating | Rank | 1st Grade |
| Assyrians/Chaldeans/Syriacs | 0.4 /100 | #262 | Tragic 97.5% |
| Immigrants | South America | 0.4 /100 | #263 | Tragic 97.5% |
| Taiwanese | 0.4 /100 | #264 | Tragic 97.5% |
| Cubans | 0.3 /100 | #265 | Tragic 97.5% |
| Immigrants | Liberia | 0.3 /100 | #266 | Tragic 97.5% |
| Immigrants | Sierra Leone | 0.3 /100 | #267 | Tragic 97.5% |
| Immigrants | Nigeria | 0.3 /100 | #268 | Tragic 97.5% |
| West Indians | 0.3 /100 | #269 | Tragic 97.5% |
| Immigrants | Jamaica | 0.2 /100 | #270 | Tragic 97.5% |
| Immigrants | Cameroon | 0.2 /100 | #271 | Tragic 97.4% |
| Immigrants | Peru | 0.2 /100 | #272 | Tragic 97.4% |
| Immigrants | Bolivia | 0.2 /100 | #273 | Tragic 97.4% |
| Ghanaians | 0.1 /100 | #274 | Tragic 97.4% |
| Immigrants | China | 0.1 /100 | #275 | Tragic 97.4% |
| Immigrants | Philippines | 0.1 /100 | #276 | Tragic 97.4% |