Ghanaian vs Immigrants from Kuwait 4th Grade
COMPARE
Ghanaian
Immigrants from Kuwait
4th Grade
4th Grade Comparison
Ghanaians
Immigrants from Kuwait
97.0%
4TH GRADE
0.2/ 100
METRIC RATING
268th/ 347
METRIC RANK
97.7%
4TH GRADE
89.7/ 100
METRIC RATING
131st/ 347
METRIC RANK
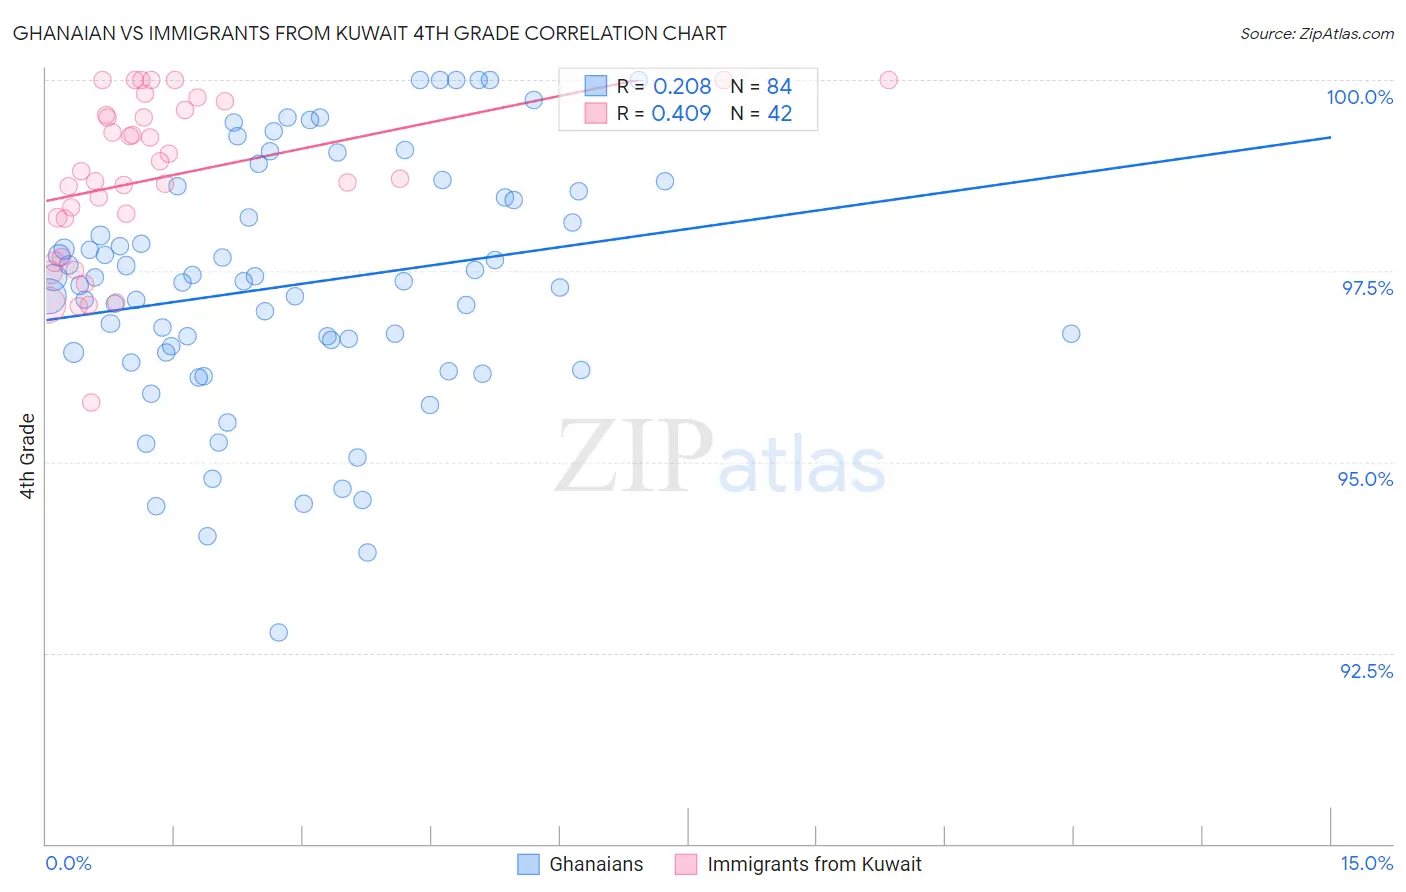
Ghanaian vs Immigrants from Kuwait 4th Grade Correlation Chart
The statistical analysis conducted on geographies consisting of 190,712,873 people shows a weak positive correlation between the proportion of Ghanaians and percentage of population with at least 4th grade education in the United States with a correlation coefficient (R) of 0.208 and weighted average of 97.0%. Similarly, the statistical analysis conducted on geographies consisting of 136,913,666 people shows a moderate positive correlation between the proportion of Immigrants from Kuwait and percentage of population with at least 4th grade education in the United States with a correlation coefficient (R) of 0.409 and weighted average of 97.7%, a difference of 0.78%.
4th Grade Correlation Summary
| Measurement | Ghanaian | Immigrants from Kuwait |
| Minimum | 92.8% | 95.8% |
| Maximum | 100.0% | 100.0% |
| Range | 7.2% | 4.2% |
| Mean | 97.3% | 98.7% |
| Median | 97.4% | 98.8% |
| Interquartile 25% (IQ1) | 96.4% | 98.2% |
| Interquartile 75% (IQ3) | 98.5% | 99.6% |
| Interquartile Range (IQR) | 2.1% | 1.4% |
| Standard Deviation (Sample) | 1.6% | 1.1% |
| Standard Deviation (Population) | 1.6% | 1.1% |
Similar Demographics by 4th Grade
Demographics Similar to Ghanaians by 4th Grade
In terms of 4th grade, the demographic groups most similar to Ghanaians are Immigrants from China (97.0%, a difference of 0.010%), Immigrants from Nigeria (97.0%, a difference of 0.010%), Armenian (97.0%, a difference of 0.020%), Immigrants from Uzbekistan (96.9%, a difference of 0.020%), and Taiwanese (97.0%, a difference of 0.030%).
| Demographics | Rating | Rank | 4th Grade |
| Immigrants | South America | 0.4 /100 | #261 | Tragic 97.0% |
| West Indians | 0.4 /100 | #262 | Tragic 97.0% |
| Immigrants | Jamaica | 0.3 /100 | #263 | Tragic 97.0% |
| Taiwanese | 0.3 /100 | #264 | Tragic 97.0% |
| Armenians | 0.3 /100 | #265 | Tragic 97.0% |
| Immigrants | China | 0.3 /100 | #266 | Tragic 97.0% |
| Immigrants | Nigeria | 0.3 /100 | #267 | Tragic 97.0% |
| Ghanaians | 0.2 /100 | #268 | Tragic 97.0% |
| Immigrants | Uzbekistan | 0.2 /100 | #269 | Tragic 96.9% |
| Cubans | 0.2 /100 | #270 | Tragic 96.9% |
| Immigrants | Peru | 0.1 /100 | #271 | Tragic 96.9% |
| Fijians | 0.1 /100 | #272 | Tragic 96.9% |
| Immigrants | Cameroon | 0.1 /100 | #273 | Tragic 96.9% |
| Trinidadians and Tobagonians | 0.1 /100 | #274 | Tragic 96.9% |
| Immigrants | Ghana | 0.1 /100 | #275 | Tragic 96.9% |
Demographics Similar to Immigrants from Kuwait by 4th Grade
In terms of 4th grade, the demographic groups most similar to Immigrants from Kuwait are Immigrants from Hungary (97.7%, a difference of 0.0%), Immigrants from Romania (97.7%, a difference of 0.010%), Hmong (97.7%, a difference of 0.010%), Immigrants from Bulgaria (97.7%, a difference of 0.020%), and Palestinian (97.7%, a difference of 0.020%).
| Demographics | Rating | Rank | 4th Grade |
| Spanish | 93.7 /100 | #124 | Exceptional 97.8% |
| Immigrants | Serbia | 92.6 /100 | #125 | Exceptional 97.8% |
| Immigrants | Europe | 92.5 /100 | #126 | Exceptional 97.8% |
| Colville | 92.3 /100 | #127 | Exceptional 97.7% |
| Pima | 92.0 /100 | #128 | Exceptional 97.7% |
| Immigrants | Bulgaria | 91.3 /100 | #129 | Exceptional 97.7% |
| Immigrants | Romania | 90.6 /100 | #130 | Exceptional 97.7% |
| Immigrants | Kuwait | 89.7 /100 | #131 | Excellent 97.7% |
| Immigrants | Hungary | 89.3 /100 | #132 | Excellent 97.7% |
| Hmong | 88.2 /100 | #133 | Excellent 97.7% |
| Palestinians | 88.1 /100 | #134 | Excellent 97.7% |
| Cambodians | 87.8 /100 | #135 | Excellent 97.7% |
| Israelis | 86.2 /100 | #136 | Excellent 97.7% |
| Immigrants | Turkey | 86.0 /100 | #137 | Excellent 97.7% |
| Blackfeet | 86.0 /100 | #138 | Excellent 97.7% |