Ghanaian vs Latvian 4th Grade
COMPARE
Ghanaian
Latvian
4th Grade
4th Grade Comparison
Ghanaians
Latvians
97.0%
4TH GRADE
0.2/ 100
METRIC RATING
268th/ 347
METRIC RANK
98.2%
4TH GRADE
99.9/ 100
METRIC RATING
37th/ 347
METRIC RANK
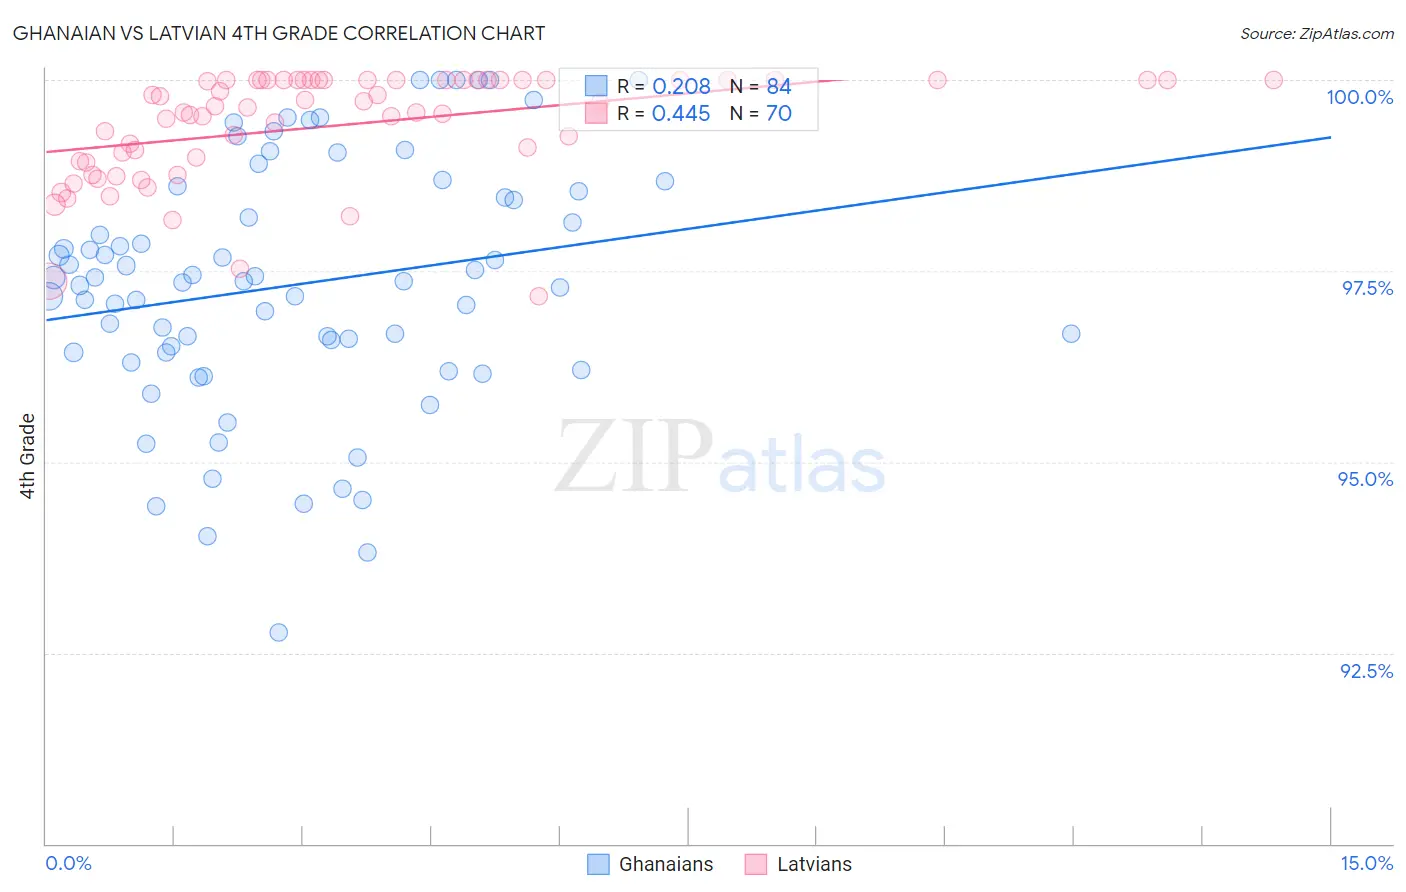
Ghanaian vs Latvian 4th Grade Correlation Chart
The statistical analysis conducted on geographies consisting of 190,712,873 people shows a weak positive correlation between the proportion of Ghanaians and percentage of population with at least 4th grade education in the United States with a correlation coefficient (R) of 0.208 and weighted average of 97.0%. Similarly, the statistical analysis conducted on geographies consisting of 220,726,452 people shows a moderate positive correlation between the proportion of Latvians and percentage of population with at least 4th grade education in the United States with a correlation coefficient (R) of 0.445 and weighted average of 98.2%, a difference of 1.3%.
4th Grade Correlation Summary
| Measurement | Ghanaian | Latvian |
| Minimum | 92.8% | 97.2% |
| Maximum | 100.0% | 100.0% |
| Range | 7.2% | 2.8% |
| Mean | 97.3% | 99.4% |
| Median | 97.4% | 99.7% |
| Interquartile 25% (IQ1) | 96.4% | 98.9% |
| Interquartile 75% (IQ3) | 98.5% | 100.0% |
| Interquartile Range (IQR) | 2.1% | 1.1% |
| Standard Deviation (Sample) | 1.6% | 0.71% |
| Standard Deviation (Population) | 1.6% | 0.70% |
Similar Demographics by 4th Grade
Demographics Similar to Ghanaians by 4th Grade
In terms of 4th grade, the demographic groups most similar to Ghanaians are Immigrants from China (97.0%, a difference of 0.010%), Immigrants from Nigeria (97.0%, a difference of 0.010%), Armenian (97.0%, a difference of 0.020%), Immigrants from Uzbekistan (96.9%, a difference of 0.020%), and Taiwanese (97.0%, a difference of 0.030%).
| Demographics | Rating | Rank | 4th Grade |
| Immigrants | South America | 0.4 /100 | #261 | Tragic 97.0% |
| West Indians | 0.4 /100 | #262 | Tragic 97.0% |
| Immigrants | Jamaica | 0.3 /100 | #263 | Tragic 97.0% |
| Taiwanese | 0.3 /100 | #264 | Tragic 97.0% |
| Armenians | 0.3 /100 | #265 | Tragic 97.0% |
| Immigrants | China | 0.3 /100 | #266 | Tragic 97.0% |
| Immigrants | Nigeria | 0.3 /100 | #267 | Tragic 97.0% |
| Ghanaians | 0.2 /100 | #268 | Tragic 97.0% |
| Immigrants | Uzbekistan | 0.2 /100 | #269 | Tragic 96.9% |
| Cubans | 0.2 /100 | #270 | Tragic 96.9% |
| Immigrants | Peru | 0.1 /100 | #271 | Tragic 96.9% |
| Fijians | 0.1 /100 | #272 | Tragic 96.9% |
| Immigrants | Cameroon | 0.1 /100 | #273 | Tragic 96.9% |
| Trinidadians and Tobagonians | 0.1 /100 | #274 | Tragic 96.9% |
| Immigrants | Ghana | 0.1 /100 | #275 | Tragic 96.9% |
Demographics Similar to Latvians by 4th Grade
In terms of 4th grade, the demographic groups most similar to Latvians are Aleut (98.2%, a difference of 0.0%), Belgian (98.2%, a difference of 0.010%), Luxembourger (98.2%, a difference of 0.010%), British (98.2%, a difference of 0.020%), and Eastern European (98.2%, a difference of 0.020%).
| Demographics | Rating | Rank | 4th Grade |
| Scandinavians | 100.0 /100 | #30 | Exceptional 98.3% |
| Europeans | 100.0 /100 | #31 | Exceptional 98.3% |
| Chinese | 100.0 /100 | #32 | Exceptional 98.3% |
| Swiss | 100.0 /100 | #33 | Exceptional 98.2% |
| Chippewa | 100.0 /100 | #34 | Exceptional 98.2% |
| Italians | 100.0 /100 | #35 | Exceptional 98.2% |
| British | 100.0 /100 | #36 | Exceptional 98.2% |
| Latvians | 99.9 /100 | #37 | Exceptional 98.2% |
| Aleuts | 99.9 /100 | #38 | Exceptional 98.2% |
| Belgians | 99.9 /100 | #39 | Exceptional 98.2% |
| Luxembourgers | 99.9 /100 | #40 | Exceptional 98.2% |
| Eastern Europeans | 99.9 /100 | #41 | Exceptional 98.2% |
| Hungarians | 99.9 /100 | #42 | Exceptional 98.2% |
| Northern Europeans | 99.9 /100 | #43 | Exceptional 98.2% |
| Native Hawaiians | 99.9 /100 | #44 | Exceptional 98.1% |